
Cambridge IGCSE Biology Revision
Explore Cambridge IGCSE revision topics. This qualification is not a GCSE; the existing guide address and saved checklist are retained. Check the official specification for complete requirements.
Your qualification choice could not be saved in this browser.
Verified qualification
Cambridge IGCSE Biology (0610)
Exam years · 2027Specification version · Version 3
Course details
Assessment The assessment includes Paper 1, Paper 2, Paper 3, Paper 4, Paper 5 and Paper 6; see the official specification for the full structure.
Tick a point after revising it. Progress is saved on this device and does not measure mastery.
Reviewed course guidance
Revision points, with the explanation beside them
Open a point to read what to know, how to use it in an assessment, a plain-language explanation and a self-check. Answers stay hidden until you choose to reveal them.
Options and source
Subject-content route
- Core
- Extended (Core and Supplement)
§3, p. 12 and §4, p. 49: Core candidates study Core; Extended candidates study Core and Supplement.
Practical examination
- Paper 5: Practical Test
- Paper 6: Alternative to Practical
Progress could not be saved in this browser. Your ticks will remain for this page view only.
Topic group
Topic 1 Core
- Course content
Scope: Course content · Subject-content route: any of Core, Extended (Core and Supplement) · §3 Topic 1: §1.1 Core 1(a)–(g); §1.2 Core 1–4; §1.3 Core 1–3
Open revision guidance
What to know
- For §1.1 Core 1(a)–(g), identify and distinguish all seven life processes: movement changes an organism’s position/place; respiration is cellular chemical reactions that break down nutrient molecules and release energy for metabolism; sensitivity detects and responds to internal/external change; growth is permanent increase in size and dry mass; reproduction makes more of the same kind; excretion removes metabolic waste and substances in excess; nutrition takes in materials for energy, growth and development. Respiration is not breathing; excretion is not removal of undigested faeces.
- For §1.2 Core 1–3, classify by shared features; a species is a group whose members can reproduce to make fertile offspring; its scientific binomial name has two parts, genus then species. Write genus with an initial capital and species lower-case, conventionally italicised (or underlined separately when handwritten). For §1.2 Core 4, construct/follow a dichotomous key by selecting one observable contrasting character at each paired step, then follow the numbered route to an identification.
- For §1.3 Core 1–3, compare kingdom-level plant and animal features: both are multicellular eukaryotes; plants have cellulose walls, usually chloroplasts and make organic food by photosynthesis, while animals lack cell walls/chloroplasts and obtain organic food by feeding. Vertebrates have a backbone; the source-limited vertebrate groups are mammals, birds, reptiles, amphibians and fish. Arthropods have a segmented body, jointed legs and an exoskeleton; distinguish myriapods (many segments/legs), insects (three leg pairs), arachnids (four leg pairs) and crustaceans (usually two antenna pairs and many legs). Use the distinguishing feature, not size or habitat, to classify.
What to do in an assessment
- To use an unfamiliar dichotomous key, start at its first paired statements, choose the one that matches a directly observed character, follow its instruction, and repeat until a taxon is reached. In a written classification, quote the observed feature that supports the group.
In plain language
Living processes describe what organisms do; classification places organisms using shared, observable features and a precise species name.
Self-check
An organism is multicellular, has a backbone, feathers and a beak. Identify its kingdom and vertebrate group, and give the key evidence. Then distinguish excretion from egestion.
Show the answer
It is an animal and a bird vertebrate: feathers and a beak are the stated identifying features, while the backbone establishes vertebrate status. Excretion removes metabolic wastes or excess substances; egestion removes undigested food as faeces.
Topic group
Topic 1 Supplement
- Course content
Scope: Course content · Subject-content route: Extended (Core and Supplement) · §3 Topic 1: §1.2 Supplement 5–7; §1.3 Supplement 4–7
Open revision guidance
What to know
- For §1.2 Supplement 5–7, classification systems aim to reflect evolutionary relationships. DNA base sequences provide evidence for classification: organisms sharing a more recent common ancestor are more closely related and have more similar DNA base sequences than organisms whose common ancestor is distant. Treat sequence similarity as evidence of relatedness, not as a visible feature or proof that present-day species are identical.
- For §1.3 Supplement 4, recognise five kingdoms: animals are multicellular eukaryotes without cell walls or chloroplasts and obtain nutrition by feeding; plants are multicellular eukaryotes with cellulose walls and chloroplasts and photosynthesise; fungi have cell walls and feed by saprotrophic nutrition (many form hyphae/mycelium; yeast is unicellular); prokaryotes are unicellular cells without a nucleus and have circular DNA; protoctists are eukaryotes, mostly unicellular, with some plant-like photosynthetic forms and some animal-like forms.
- For §1.3 Supplement 5–6, ferns reproduce by spores and have fronds; flowering plants reproduce using flowers/seeds. Among flowering plants, dicotyledons typically have two cotyledons, net-veined leaves and floral parts in fours/fives; monocotyledons typically have one cotyledon, parallel-veined leaves and floral parts in threes. Use combinations of those syllabus features to classify, rather than relying on one variable feature. Supplement 7: a virus consists of genetic material enclosed in a protein coat; it is not a cell.
What to do in an assessment
- Compare candidate organisms against a set of stated kingdom or plant-group characters. For evolutionary evidence, state both the sequence evidence and the inference: greater base-sequence similarity supports closer relationship/recent common ancestry.
In plain language
Supplement classification uses DNA evidence to reflect ancestry and applies more detailed kingdom and plant-group features.
Self-check
Species A and B share 96% of a compared DNA base sequence; A and C share 72%. Which pair is more closely related, and what is the evidence? Also, what two structures define a virus at this syllabus level?
Show the answer
A and B are more closely related because their compared DNA base sequences are more similar, supporting a more recent common ancestor. A virus has genetic material and a protein coat.
Topic group
Topic 2 Core
- Course content
Scope: Course content · Subject-content route: any of Core, Extended (Core and Supplement) · §3 Topic 2 §2.1 Core 1–2 and 4–7; excludes Core 3 diagram/image identification, which is tracked in separate diagram and image requirements.
Open revision guidance
What to know
- Compare plant and animal cells using only the syllabus list: both have a cell membrane, cytoplasm, nucleus, ribosomes and mitochondria; plant cells also have a cellulose cell wall, chloroplasts in photosynthesising cells, and a large permanent vacuole. Bacterial cells have a cell wall, cell membrane, cytoplasm and ribosomes, with circular DNA and plasmids; the DNA is not enclosed in a nucleus. Functions: membrane controls exchange; cytoplasm is where many reactions occur; nucleus contains genetic material and controls activities; ribosomes make proteins; mitochondria are sites of aerobic respiration; chloroplasts carry out photosynthesis; cell wall supports and strengthens; vacuole contains cell sap and helps maintain turgor; bacterial circular DNA carries essential genes and plasmids carry additional genes.
- Use the named specialisations and functions: ciliated cells move mucus in trachea/bronchi; root hair cells absorb; palisade mesophyll cells photosynthesise; neurones conduct electrical impulses; red blood cells transport oxygen; sperm and egg cells are gametes for reproduction. New cells arise by division of existing cells. A cell is the basic unit; a tissue is similar cells working together; an organ is tissues working together; an organ system is organs working together; an organism is an individual living thing (for example, muscle cell → muscle tissue → heart → circulatory system → person).
What to do in an assessment
- For a cell comparison, name the structure, state which cell types have it and give its function; for levels of organisation, explain how the example at each level contributes to the next.
In plain language
Cells share basic structures, but their differences and specialisations relate to their functions; groups of cells build tissues, organs and organisms.
Self-check
Name two structures found in plant cells but not animal cells, state one function for each, and give the role of a root hair cell.
Show the answer
Cell wall supports and strengthens; chloroplasts carry out photosynthesis (in photosynthesising cells). A root hair cell absorbs water and mineral ions; its syllabus-listed specialised function is absorption.
- Course content
Scope: Course content · Subject-content route: any of Core, Extended (Core and Supplement) · §3 Topic 2, §2.2 Core 1–2
Open revision guidance
What to know
- Use magnification = image size ÷ actual size. Rearrange as image size = magnification × actual size, or actual size = image size ÷ magnification. Put image and actual size in the same units before calculating; magnification has no unit. A larger image does not mean a larger actual specimen if magnifications differ.
What to do in an assessment
- Write the formula, substitute with matching units, show the calculation, and state a length answer in millimetres as required by the Core outcome.
In plain language
Magnification compares the measured image with the specimen’s real size.
Self-check
An image is 24 mm long at ×6 magnification. What is the actual length?
Show the answer
Actual size = 24 mm ÷ 6 = 4 mm.
Topic group
Topic 2 Core visual gap
- Course content
Scope: Course content · Subject-content route: any of Core, Extended (Core and Supplement) · §3 Topic 2 §2.1 Core 3 diagram-identification component; schematic plant, animal and bacterial cell diagrams are covered, with the image-recognition component separated.
Open revision guidance
What to know
- Classify the whole cell before naming structures: plant cells may show a cellulose wall, chloroplasts and a large permanent vacuole; animal cells lack those features; bacteria have no nucleus and show circular DNA/plasmids. Then identify boundaries and internal structures from the exact source diagram: trace each leader line to its endpoint, distinguish membrane from wall, and match each label to one feature. A list or imagined diagram is not evidence of diagram-identification skill. Required practice: unlabelled schematic plant and animal cell diagrams containing the full source-listed structures, and bacterial-cell diagrams containing cell wall, membrane, cytoplasm, ribosomes, circular DNA and plasmid, each with an answer key.
What to do in an assessment
- On a supplied diagram first state the cell class and distinguishing visible evidence; then trace leader lines to endpoints, label one structure at a time and check that the name matches the line rather than a nearby feature. Recheck by comparing labelled and unlabelled schematic diagrams; use the attached gallery practice, then reveal its keyed answer to check every structure and leader line.
In plain language
Classify a cell diagram, then trace and label structures accurately; the source-required real-image recognition is a separate scope.
Self-check
What can schematic practice establish, and what distinct source outcome remains unfulfilled?
Show the answer
The gallery teaches diagram labelling for plant, animal and bacterial cells. The separate requirement to identify those cell types from actual images is still uncovered.
View diagrams
Plant cell · Unlabelled practice · Schematic, simplified and not to scale. Show labelled key: Answer key for plant-cell
Plant cell · Structure key · Schematic, simplified and not to scale. Animal cell · Unlabelled practice · Schematic, simplified and not to scale. Show labelled key: Answer key for animal-cell
Animal cell · Structure key · Schematic, simplified and not to scale. Bacterial cell · Unlabelled practice · Schematic, simplified and not to scale. Show labelled key: Answer key for bacterial-cell
Bacterial cell · Structure key · Schematic, simplified and not to scale. Practise matching plant, animal and bacterial cell structures to the required labels; use the key to check cell boundaries, organelles, DNA and plasmids.
Topic group
Topic 2 Supplement
- Course content
Scope: Course content · Subject-content route: Extended (Core and Supplement) · §3 Topic 2, §2.2 Supplement 3
Open revision guidance
What to know
- One millimetre is 1000 micrometres: 1 mm = 1000 μm. Convert mm to μm by multiplying by 1000; convert μm to mm by dividing by 1000. Check scale: a micrometre is smaller than a millimetre, so the numerical value increases when a length is expressed in μm.
What to do in an assessment
- Write the conversion factor before moving the decimal point and retain the unit through the calculation.
In plain language
A micrometre is one-thousandth of a millimetre.
Self-check
Convert 0.085 mm to μm.
Show the answer
0.085 × 1000 = 85 μm.
Topic group
Movement into and out of cells
- Course content
Scope: Course content · Subject-content route: any of Core, Extended (Core and Supplement) · §3, Topic 3: §3.1 Core outcomes 1–5; §3.2 Core outcomes 1–6; §3.3 Core outcome 1.
Open revision guidance
What to know
- Diffusion is the net movement of particles from higher to lower concentration, down a concentration gradient, because particles move randomly. That movement uses their kinetic energy; it does not require the cell to spend energy. A net flow can occur even while particles continue moving in both directions. Small molecules and ions can diffuse through cell membranes. In organisms, oxygen diffuses from lungs into blood and from blood into respiring cells; carbon dioxide diffuses the opposite way, and dissolved solutes can move between cells and their surroundings.
- Four factors affect diffusion rate: a larger surface area allows more particles to cross at once; a higher temperature increases particle kinetic energy and movement; a steeper concentration gradient increases net movement; a shorter diffusion distance speeds transfer. In an agar-cube model, cut identical-shape cubes of different sizes, put them in the same volume and concentration of indicator/acid for equal times, rinse and measure the decolourised depth or remaining coloured fraction. Change only cube size, repeat, and relate the result to surface-area-to-volume ratio and distance. Label any supplied dataset as model evidence, not a direct measurement of cell transport.
- Water is a solvent: digestion occurs in aqueous conditions, dissolved substances can be transported in blood or plant sap, and dissolved waste can be excreted. Osmosis is diffusion of water through a partially permeable membrane; water passes through the cell membrane into or out of cells. Plants are supported when water inside cells presses outwards on cell walls. The water-potential direction and detailed plant-cell states are treated separately in the Extended-only Supplement.
- Dialysis-tubing osmosis method: soak and tie one end of the tubing, fill with a measured volume of sucrose solution, remove air, tie the other end, rinse the outside, blot and record initial mass. Immerse in a measured volume of water for a fixed time, then blot consistently and reweigh. Use a water-filled bag or equal-concentration solution as a control when appropriate; repeat and calculate mean percentage mass change = (final − initial) ÷ initial × 100. A mass increase indicates net water entry through the partially permeable tubing. Keep tubing length, solution volume/concentration, temperature and time controlled. Do not taste laboratory solutions.
- Plant-tissue comparison: cut equal-sized potato cylinders, record initial mass, place in different known sucrose concentrations for the same time, blot in the same way and record final masses. Repeat each concentration and graph mean percentage mass change against concentration. A mass gain means net water entered the cells; a loss means net water left. The Core outcomes ask for investigation and description, so explain the measured mass change as evidence of water movement and do not claim that the balance directly shows individual water molecules.
- Active transport moves particles through a cell membrane from lower to higher concentration, against the concentration gradient, using energy from respiration. Unlike diffusion and osmosis, it can accumulate a substance where its concentration is already greater. Root cells can take up mineral ions from dilute soil solution into cells where ion concentration is higher; energy released in respiration is needed. Do not say that water itself is actively transported in this example.
What to do in an assessment
- For a movement question, identify the particle and membrane first, compare concentrations on the two sides, then decide: down-gradient random net movement is diffusion; water through a partially permeable membrane is osmosis; uphill movement using respiratory energy is active transport.
- For a practical, write the independent variable, measured dependent variable, at least two controlled variables, repeats and a suitable comparison/control. State how the result supports a claim, and distinguish a model or proxy measurement from the biological process itself.
- Exam trap: diffusion has a net direction but particles still move randomly; osmosis is specifically water crossing a partially permeable membrane; active transport is against a concentration gradient and requires energy from respiration.
In plain language
Particles can spread down a concentration difference, water can cross a partly selective membrane, and cells can spend respiratory energy to move selected particles uphill.
Self-check
A dialysis bag containing concentrated sucrose gains mass in water. Which process best explains this, what crossed the tubing, and what does the mass change show?
Show the answer
Osmosis: water crossed the partially permeable tubing from the more dilute surrounding water toward the more concentrated solution. The gain is evidence of net water entry; sucrose should not be described as the particle responsible for that mass gain.
- Course content
Scope: Course content · Subject-content route: Extended (Core and Supplement) · §3, Topic 3: §3.2 Supplement outcomes 7–9; §3.3 Supplement outcomes 2–3.
Open revision guidance
What to know
- Water potential describes the tendency of water molecules to move. For this syllabus, water moves by osmosis from higher water potential (a dilute solution) to lower water potential (a concentrated solution) through a partially permeable membrane. State both the direction and the membrane; solute particles need not cross for water to move.
- Plant-cell responses depend on the surrounding solution. In a dilute external solution, water enters: the vacuole expands and the cell becomes turgid; outward pressure of cell contents against the cell wall is turgor pressure, supporting the plant. In a concentrated external solution, water leaves; the cell becomes flaccid as turgor falls. With greater water loss, the cell membrane/cytoplasm pulls away from the wall: plasmolysis. Use these terms to explain observations rather than treating them as synonyms.
- Water potential and osmosis explain uptake and loss of water by organisms: water enters root-hair cells from soil when the water-potential relationship favours entry, and water can leave cells when the surrounding solution has lower water potential. Cell walls resist expansion in plant cells; animal cells have no wall. Osmosis therefore affects cell volume and organism water balance.
- Active transport matters when molecules or ions must cross membranes against a concentration gradient. Root hairs can take up mineral ions from soil solution even when the soil concentration is lower than the concentration inside the cell. The cell uses energy from respiration, and membrane protein carriers move the particular ions or molecules across; carriers do not make this passive diffusion.
What to do in an assessment
- For plant-cell immersion, compare external and cell-sap water potentials, state the direction of water movement, then link it to turgor pressure and the correct state: turgid, flaccid or plasmolysed.
- For a root-ion question, explicitly say that uptake can be against the concentration gradient, uses energy from respiration and involves protein carriers in the cell membrane.
In plain language
Water moves from higher to lower water potential through a partly permeable membrane; active transport uses energy and carrier proteins to move selected particles uphill.
Self-check
A plant cell is placed in a concentrated solution and its protoplast pulls away from the cell wall. Name the state and explain the sequence.
Show the answer
The cell is plasmolysed. The surrounding solution has lower water potential, so water leaves by osmosis; the cell loses turgor and the protoplast pulls away from the wall.
Topic group
Biological molecules
- Course content
Scope: Course content · Subject-content route: any of Core, Extended (Core and Supplement) · §3, Topic 4, §4.1 Core outcomes 1; 2(a)–(c); 3(a)–(e).
Open revision guidance
What to know
- Carbohydrates and fats/oils contain carbon, hydrogen and oxygen; proteins contain carbon, hydrogen, oxygen and nitrogen. Large molecules are assembled from smaller units: starch, glycogen and cellulose are made from glucose; proteins from amino acids; fats and oils from fatty acids and glycerol. Do not confuse the building units: fatty acids plus glycerol are not amino acids.
- Food-test method and positive result: add iodine solution to a sample; a blue-black colour indicates starch (negative remains orange-brown). For reducing sugar, add Benedict’s solution and heat the tube in a hot-water bath; blue changes through green/yellow/orange toward brick-red precipitate as reducing sugar is present. For protein, add Biuret reagent (or the specified Biuret reagents) and a lilac/purple result is positive; blue is negative. For fats/oils, mix the sample with ethanol, then add water; a cloudy white emulsion is positive. For vitamin C, add sample to blue DCPIP; decolourisation indicates vitamin C.
- To compare unknown food samples fairly, use equal sample mass/volume, reagent volumes, temperature and heating time; label tubes, use clean apparatus to prevent cross-contamination, and record the observed colour before interpreting it. For an approximate comparison, use a dilution series or count standardised drops needed to decolourise a fixed DCPIP volume; describe this as a comparative estimate, not an exact concentration unless a calibration curve is provided.
- Practical safety: wear eye protection; do not taste samples or reagents; use a rack and test-tube holder; heat Benedict’s solution in a hot-water bath rather than over a naked flame; ethanol is flammable, so keep it away from flames and use a teacher-approved method. Follow local disposal instructions.
What to do in an assessment
- Match molecule to building units, then answer food-test questions in the order: sample + reagent/procedure → positive observation → what that observation supports. Include heating only for Benedict’s test.
- A negative test means that the specified positive indicator was not observed under those test conditions; it does not prove that every molecule of that nutrient is absent.
In plain language
Foods contain characteristic biological molecules; named chemical tests use a visible colour change or emulsion to indicate them.
Self-check
A food sample gives a lilac result with Biuret reagent, and an ethanol mixture turns cloudy after water is added. What two groups are indicated?
Show the answer
Protein and fat/oil, respectively. The lilac Biuret result indicates protein; the cloudy white ethanol emulsion indicates fat or oil.
- Course content
Scope: Course content · Subject-content route: Extended (Core and Supplement) · §3, Topic 4, §4.1 Supplement outcome 4(a)–(d).
Open revision guidance
What to know
- A DNA molecule has two strands coiled together as a double helix. Each strand contains chemical units called bases. Bonds between pairs of bases hold the two strands together. Pairing is specific and consistent: A pairs with T, and C pairs with G. Full names of the bases are not required by this outcome.
- When interpreting a simple DNA ladder/schematic, follow one strand in order and place the complementary partner opposite each base: an A on one strand requires T on the other, and a C requires G. The strands are complementary, not identical; the pairing pattern is the evidence that the bases match.
What to do in an assessment
- Label the molecule as two coiled strands, identify bases on each strand and show bonds between paired bases. For a sequence-completion question, apply A–T and C–G at every position.
In plain language
DNA is two coiled strands held together by bonds between matching base pairs: A–T and C–G.
Self-check
What complementary strand matches A C T G?
Show the answer
T G A C: pair A with T and C with G at every position.
Topic group
Enzymes
- Course content
Scope: Course content · Subject-content route: any of Core, Extended (Core and Supplement) · §3, Topic 5, §5.1 Core outcomes 1–5.
Open revision guidance
What to know
- A catalyst increases the rate of a chemical reaction and is not changed by the reaction. Enzymes are proteins that act as biological catalysts in metabolic reactions. Metabolism is the set of chemical reactions in cells; without enzyme-controlled reactions proceeding sufficiently quickly, organisms could not sustain life.
- An enzyme has an active site whose shape is complementary to its substrate. The substrate fits, the reaction occurs and product(s) form; the enzyme is not used up. Enzymes are biological catalysts, so this account connects their protein nature, action and importance.
- Each enzyme has conditions under which activity is greatest: its optimum temperature and optimum pH. Below the optimum, activity is slower; above the optimum, the enzyme may denature and the active-site shape changes, so the substrate no longer fits properly. A pH far from the optimum can also alter active-site shape and denature the enzyme. Use the term denaturation for a lasting structural change that prevents the normal fit, not merely for any temporary slowing.
- Investigation with amylase and starch: place equal measured volumes/concentrations of amylase and starch in separate tubes in a water bath at a chosen temperature; equilibrate, mix, start a timer and at fixed intervals place a drop on iodine in a spotting tile. Record the time until iodine no longer turns blue-black (starch is no longer detected). To test pH, use buffer solutions and hold temperature, volumes, concentrations and sampling interval constant. Repeat at each temperature/pH and compare mean time or rate (for example, 1 ÷ time, using consistent units).
- Illustrative hypothetical temperature results, not source data: mean time for starch to disappear was 180 s at 20°C, 70 s at 35°C and 240 s at 60°C. The shorter time at 35°C indicates faster starch breakdown in this example; the longer time at 60°C is consistent with high-temperature denaturation. Do not conclude the exact optimum from only these three points—test more temperatures around the fastest result. Keep enzyme and starch concentrations equal and use a thermostatically controlled bath.
- Practical care: wear eye protection, use a water bath rather than a flame, handle warm tubes with a holder and avoid skin/eye contact with solutions. Use small iodine drops and a tile; do not ingest reagents. In a timed endpoint test, use the same mixing, drop size and sampling interval each time.
What to do in an assessment
- For a graph, identify the optimum from the peak rate (or shortest reaction time), describe the trend on either side, then explain it using temperature/pH and active-site fit. Do not call faster particle movement the cause of denaturation.
- In a method question, distinguish independent variable (temperature or pH) from the measured endpoint/time, name controls, say how repetitions improve reliability and define the endpoint.
In plain language
Enzymes are protein catalysts; their active-site fit makes reactions happen fast enough for life, and temperature or pH can change their activity.
Self-check
Why might amylase work more slowly at 60°C than at 35°C in the hypothetical test?
Show the answer
At 60°C the enzyme may be denatured: its active-site shape changes, so starch fits less well and fewer enzyme-substrate interactions produce product. The example suggests a difference but does not establish a universal optimum.
- Course content
Scope: Course content · Subject-content route: Extended (Core and Supplement) · §3, Topic 5, §5.1 Supplement outcomes 6–9.
Open revision guidance
What to know
- The substrate binds at an enzyme’s active site, forming an enzyme–substrate complex. The reaction converts substrate to product(s); products leave and the enzyme can catalyse another reaction. An enzyme’s specificity follows from the complementary shape and fit of its active site to its substrate; a substrate with a different shape does not fit in the same way.
- As temperature rises toward an enzyme’s optimum, molecules gain kinetic energy and move faster, increasing the frequency of collisions and the number of effective enzyme–substrate collisions; rate rises. Above the optimum, heat changes the enzyme’s shape (denaturation), altering fit, so rate falls. A higher collision frequency cannot compensate once the active site is denatured.
- A change in pH away from the optimum can alter active-site shape and fit. At sufficiently extreme pH the enzyme denatures; fewer substrates form suitable complexes and the rate falls. Different enzymes have different optimum temperatures and pH values, so state the conditions for the enzyme under investigation rather than assuming one universal optimum.
- A fair enzyme investigation changes one condition at a time. For temperature, keep pH and reactant/enzyme volumes and concentrations fixed; for pH, use buffers while holding temperature fixed. Include a no-enzyme or inactive-enzyme comparison where useful, repeat measurements, and use a clearly defined rate endpoint. Example only: if equal starch samples disappear more quickly at pH 7 than pH 3, the result supports greater amylase activity under the pH 7 conditions, not the claim that every enzyme has pH 7 as its optimum.
What to do in an assessment
- Explain a rate curve as a causal chain: temperature → kinetic energy/collision frequency → rate rises up to optimum; above optimum → denaturation/changed shape and fit → rate falls. For pH, explain changed shape/fit and denaturation rather than attributing the effect to kinetic energy.
- Use the terms substrate, active site, enzyme–substrate complex and product accurately; specificity is about complementary shape and fit.
In plain language
Specific fit allows an enzyme to bind its substrate; conditions affect how often useful complexes form and whether the active site keeps its shape.
Self-check
Why does raising temperature increase enzyme rate below the optimum but reduce it above the optimum?
Show the answer
Below the optimum, greater kinetic energy increases effective collision frequency. Above the optimum, denaturation changes the active-site shape and reduces substrate fit, so rate falls.
Topic group
Plant nutrition
- Course content
Scope: Course content · Subject-content route: any of Core, Extended (Core and Supplement) · §3, Topic 6: §6.1 Core outcomes 1–9, including 5(a)–(e) and 6(a)–(b); §6.2 Core outcomes 1–3, including the visual-identification list in outcome 2.
Open revision guidance
What to know
- Photosynthesis is the process by which plants use light energy to synthesise carbohydrates from raw materials. Word equation: carbon dioxide + water → glucose + oxygen, in the presence of light and chlorophyll. Chlorophyll is a green pigment in chloroplasts; it transfers energy from light into chemical energy used to synthesise carbohydrates.
- The glucose/carbohydrate made has several fates: starch is an energy store; cellulose builds cell walls; glucose is used in respiration to provide energy; sucrose is transported in phloem; nectar attracts insects for pollination. Nitrate ions are needed to make amino acids, which are used to make proteins; magnesium ions are needed to make chlorophyll. Yellowing or poor growth can be discussed in relation to lack of these mineral ions without claiming minerals are food or an energy source.
- To test a leaf for starch, first destarch the plant in darkness, expose the experimental part to light (cover a region or use a variegated leaf), then remove a leaf. Kill the leaf briefly in boiling water, decolourise it in ethanol heated in a hot-water bath, rinse/soften it and add iodine: blue-black indicates starch. To show the need for light, compare covered and uncovered regions; for chlorophyll, compare green and non-green regions of a variegated leaf; for carbon dioxide, compare a plant with CO₂ available to a matched plant with CO₂ removed using an appropriate absorbent. Keep other conditions alike and include a control. Never heat ethanol over a naked flame; use teacher supervision, eye protection and forceps.
- To test environmental effects, measure oxygen bubbles or volume from an aquatic plant over a fixed time as a proxy for photosynthesis rate. Change one factor—lamp distance/light intensity, carbon-dioxide availability/concentration, or temperature—while keeping plant length/species, exposure time and the other conditions constant; allow equilibration, repeat and compare means. Lamp distance is only a proxy for intensity unless measured. A hypothetical example: at equal time, a plant produces 12, 22 and 23 bubbles/min at increasing lamp intensity; the near-plateau from 22 to 23 suggests another factor may now limit rate. Bubbles are a proxy, not a direct count of glucose molecules.
- Hydrogencarbonate indicator shows carbon-dioxide changes: in light an aquatic plant may remove CO₂ by photosynthesis and indicator shifts toward its low-CO₂ colour; in darkness respiration releases CO₂ and it shifts toward its high-CO₂ colour. A no-plant control and equal indicator volumes, plant mass, tube size and exposure time help interpret the comparison. Follow teacher guidance for sealed tubes and indicator handling.
- Most leaves are thin and have a large surface area: this supports light capture and short diffusion distances for gases. The source also requires identification in diagrams and images of dicot-leaf chloroplasts, cuticle, guard cells, stomata, upper/lower epidermis, palisade/spongy mesophyll, air spaces, vascular bundles, xylem and phloem, and an explanation of how those structures adapt leaves for photosynthesis. Their functions can be taught textually: chloroplasts contain chlorophyll; transparent cuticle/upper epidermis admit light and reduce water loss; palisade cells near the upper surface capture light; spongy mesophyll air spaces aid gas diffusion; stomata/guard cells regulate gas exchange; veins deliver water and carry sucrose away. Use the attached leaf-section diagram for labelled/unlabelled structure practice, then compare its tissue pattern with the authentic dicot-leaf micrograph; the photo alone does not resolve xylem/phloem.
What to do in an assessment
- For an equation question, include reactants and products in the correct direction, and state that light and chlorophyll are conditions, not chemical reactants. For a rate graph, identify the changed factor, measured proxy and controls before explaining a plateau as a possible change in the limiting factor.
- For the starch test, give the order: destarch → expose/control → boiling water → ethanol in a hot-water bath → rinse → iodine. For leaf image-label practice, use the attached labelled/unlabelled dicot cross-section and compare it with the genuine leaf micrograph; use the diagram, not the photo, to check the finer label targets.
In plain language
Leaves use light to make carbohydrate; the products feed growth, storage and transport, while leaf structure supports gas exchange and light capture.
Self-check
A leaf area was covered with opaque foil, then tested with iodine after illumination. The uncovered area turns blue-black but the covered area stays orange-brown. What does the comparison support?
Show the answer
Starch formed in the illuminated region but not in the covered region, supporting the need for light for photosynthesis under these conditions. The iodine result detects starch, a product/storage form of carbohydrate.
View diagrams
Dicot leaf section · Unlabelled practice · Schematic, simplified and not to scale. Show labelled key: Answer key for leaf-section
Dicot leaf section · Structure key · Schematic, simplified and not to scale. 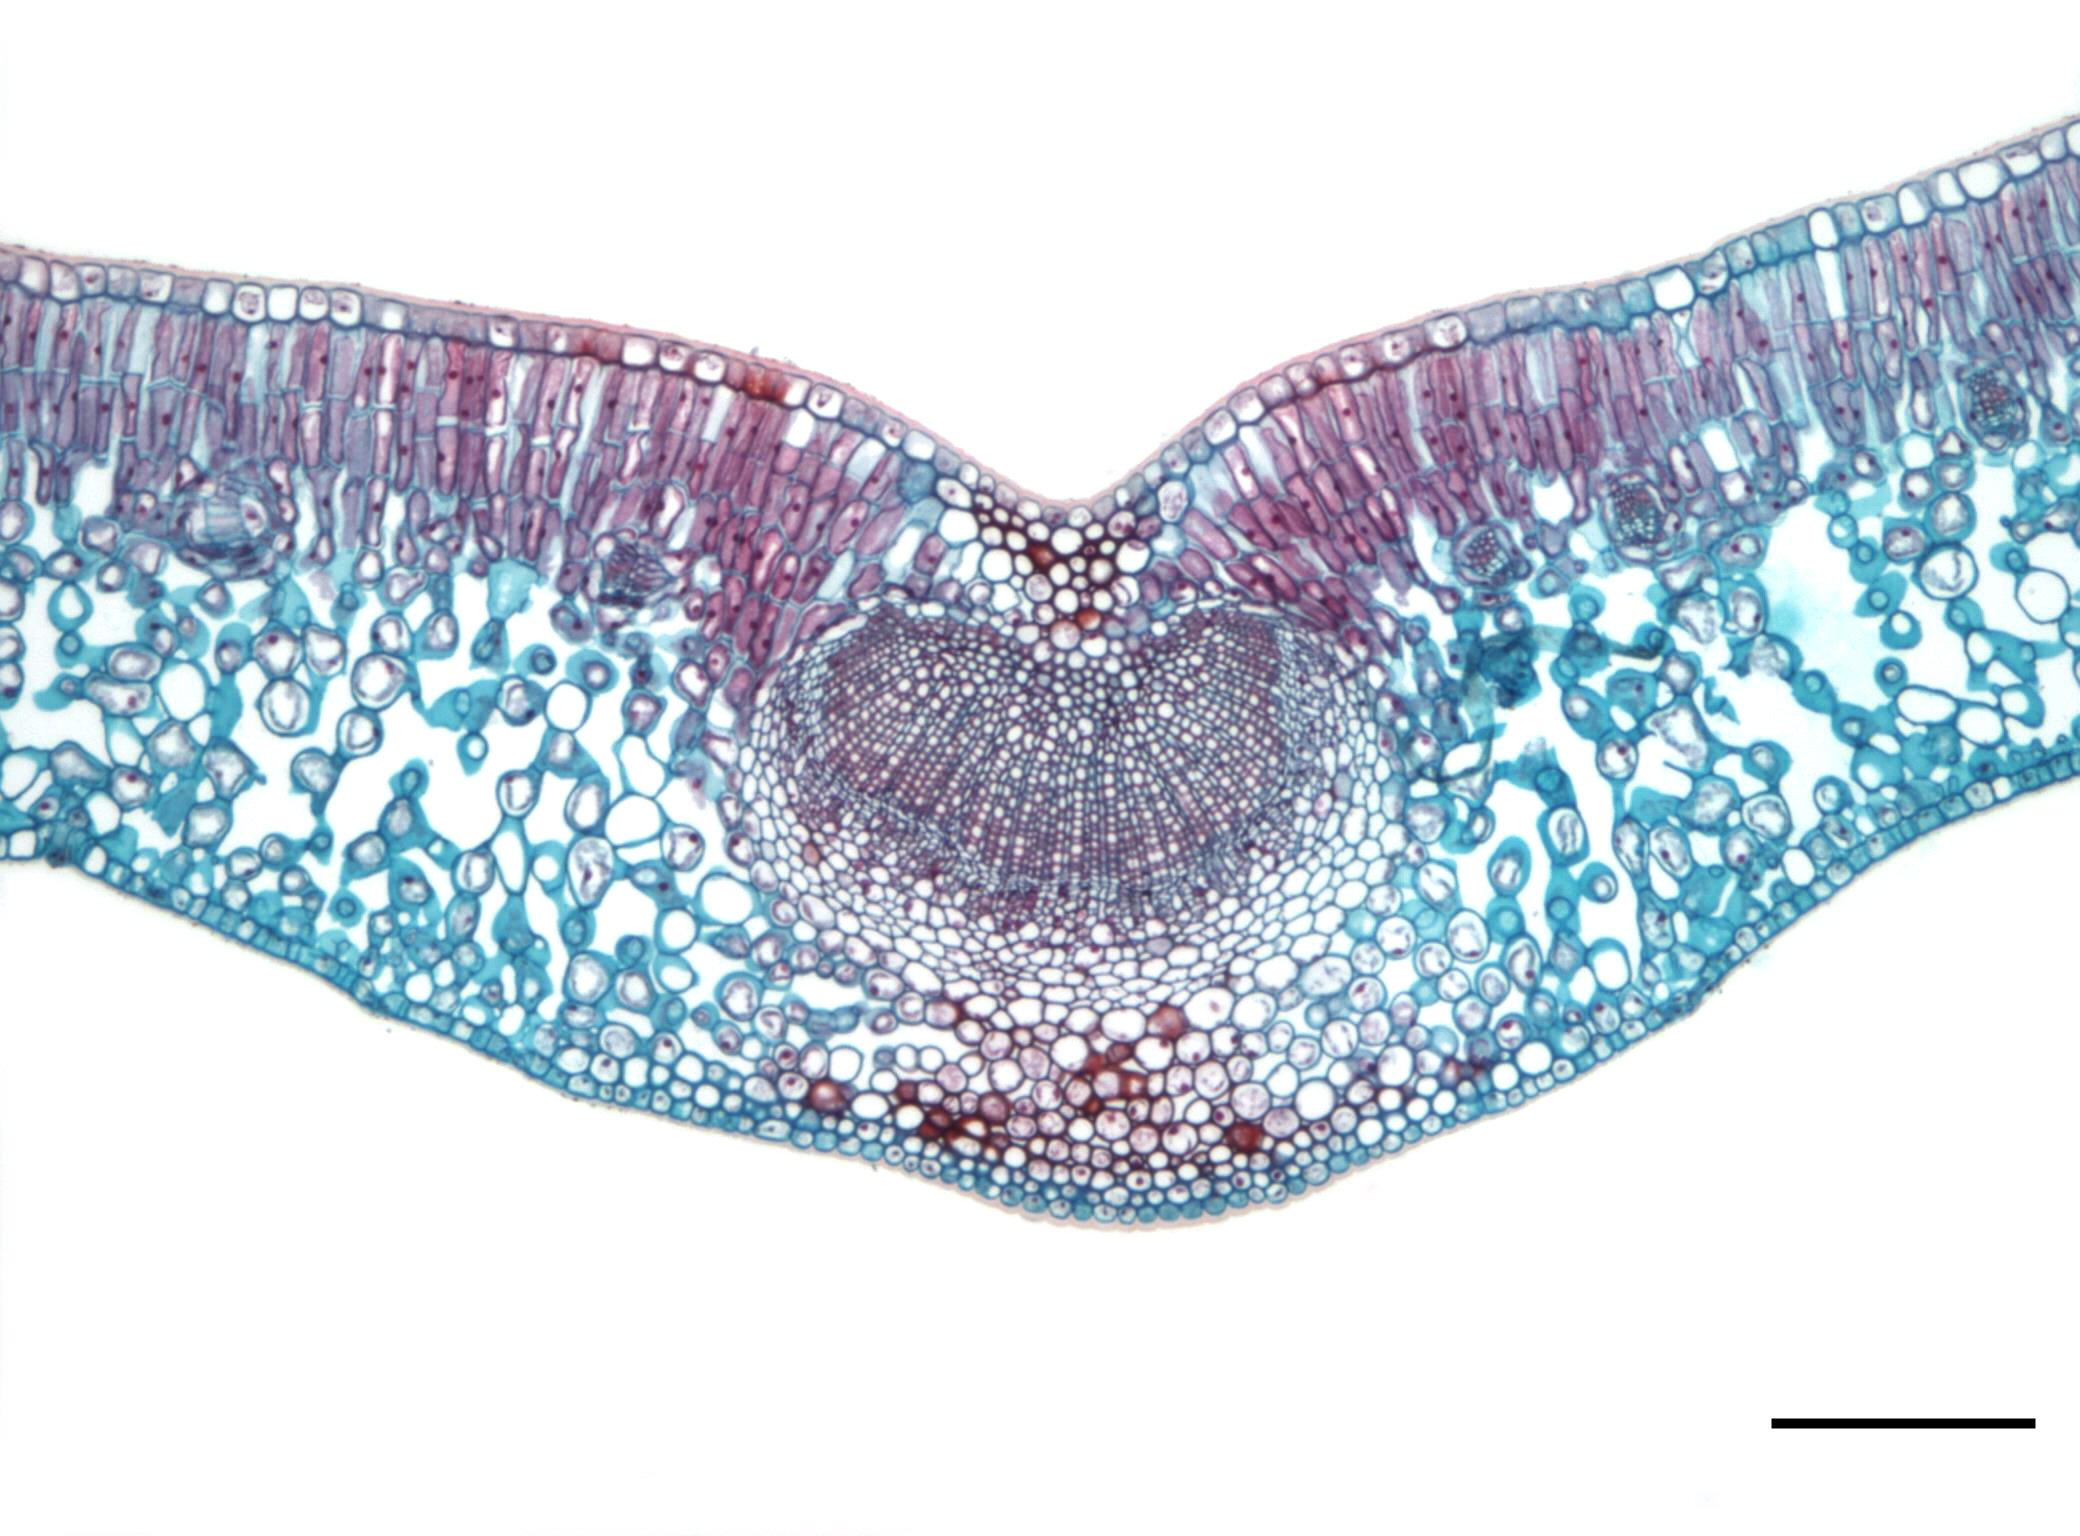
Practice question
Read the section from its more regular, column-like tissue toward the looser tissue with larger spaces. Which leaf regions can you recognise, and where is the vein?
Photograph / micrograph recognition only. Species is not identified. This is a dicot example, but not a species-specific specimen.
Photo: Dicot leaf · Jon Houseman; source credit also names Matthew FordPhotomicrograph with a 0.2 mm scale bar.Show labelled key: Answer key for leaf-micrograph
Dicot leaf cross-section
Photo key
The source identifies this as a dicot leaf in transverse section. Elongated palisade tissue lies beneath the upper surface; looser spongy tissue with air spaces is toward the lower surface; a central vein is visible. Individual xylem and phloem are not resolved clearly enough here to label.
Species is not identified. This is a dicot example, but not a species-specific specimen.
Photo: Dicot leaf · Jon Houseman; source credit also names Matthew FordPhotomicrograph with a 0.2 mm scale bar.Identify leaf tissues on a teaching section diagram, then compare with the genuine dicot-leaf micrograph; the photo does not resolve xylem/phloem labels by itself. - Course content
Scope: Course content · Subject-content route: Extended (Core and Supplement) · §3, Topic 6, §6.1 Supplement outcomes 10–11.
Open revision guidance
What to know
- Balanced photosynthesis equation: 6CO₂ + 6H₂O → C₆H₁₂O₆ + 6O₂. There are six carbon atoms, twelve hydrogen atoms and eighteen oxygen atoms on each side. Light energy drives the process; chlorophyll captures/transfers that energy. The equation balances atoms and is not a statement that light is a chemical reactant.
- A limiting factor is the factor in shortest supply relative to the rate possible under current conditions; increasing it raises photosynthesis rate until another factor limits. Light intensity, carbon-dioxide concentration and temperature can each limit photosynthesis in different environments. In low light, more CO₂ may have little effect; in bright light but low CO₂, extra CO₂ may increase rate; at unsuitable low temperature enzyme-controlled reactions proceed slowly, while excessive heat can damage enzymes. Read the supplied axes and conditions before choosing the limiting factor—do not assume one factor always limits.
What to do in an assessment
- Balance-check the chemical equation atom by atom. For a limiting-factor graph, state the observed pattern, name the factor being changed and explain whether it is currently limiting; if the curve plateaus, identify a different factor that could then constrain rate.
In plain language
The balanced equation conserves atoms, and whichever required condition is most restrictive can limit the photosynthesis rate.
Self-check
At fixed bright light, increasing CO₂ raises oxygen output and then the rate levels off. What does the plateau suggest?
Show the answer
CO₂ was limiting over the rising section; when the curve levels off, another condition such as light intensity or temperature may limit further increase.
Topic group
Human nutrition
- Course content
Scope: Course content · Subject-content route: any of Core, Extended (Core and Supplement) · §3 Topic 7: §7.1 Core outcomes 1–3 incl. 2(a–g); §7.2 Core 1(a–b) diagram identification and 2(a–e); §7.3 Core 1–6 with Core 3 diagram identification; §7.4 Core 1–5 incl. 3(a–c); §7.5 Core 1–2. Separate actual-image recognition is tracked independently.
Open revision guidance
What to know
- A balanced diet supplies the nutrients and energy needed by an individual in suitable amounts; needs vary with age, activity, growth and health. Principal sources and roles: carbohydrate-rich foods (for example bread, rice and potatoes) provide energy; fats/oils (oils, butter, nuts) provide energy and stored energy; protein foods (beans, eggs, fish, meat) supply amino acids for growth and tissue repair. Vitamin C from fruit/vegetables is needed for healthy tissues; vitamin D from some foods and skin production in sunlight supports calcium use and healthy bones. Calcium from dairy/fortified foods supports bones and teeth; iron from meat, beans and leafy vegetables is needed to make haemoglobin. Fibre/roughage from whole grains, fruit and vegetables helps food move through the gut. Water is needed as a solvent and for transport and chemical reactions. Scurvy is caused by vitamin C deficiency; rickets is associated with vitamin D deficiency (and inadequate calcium availability), especially during growing years.
- Digestive system route: mouth → oesophagus → stomach → small intestine (duodenum then ileum) → large intestine (colon) → rectum → anus. Associated organs are salivary glands, pancreas, liver and gall bladder. Use the attached unlabelled digestive-system figure to locate the canal and accessory organs, then reveal the labelled key; the same card includes a separate keyed dentition practice view. Function sequence: ingestion is taking food/drink into the body; digestion breaks food down; absorption moves nutrients from intestines into blood; assimilation is uptake and use of nutrients by cells; egestion removes undigested food as faeces. Egestion is not excretion of metabolic waste.
- Physical digestion breaks food into smaller pieces without chemically changing its molecules. This increases surface area exposed to enzymes during chemical digestion. Incisors cut, canines tear, premolars crush and molars grind; use the attached unlabelled dentition figure and its keyed view to practise identifying each tooth type. Tooth structure includes hard enamel outside dentine, pulp containing nerves and blood vessels, and cement; teeth are embedded in bone and gums. The stomach churns food mechanically. Bile emulsifies fats into small droplets; this is physical dispersion, not chemical breakdown, and increases surface area available for lipase.
- Chemical digestion breaks large insoluble molecules into small soluble molecules that can be absorbed. Amylase breaks starch to simple reducing sugars; proteases break protein to amino acids; lipase breaks fats/oils to fatty acids and glycerol. Salivary glands and pancreas secrete amylase, which acts in the mouth and small intestine; the stomach and pancreas secrete proteases, which act in the stomach and small intestine; the pancreas secretes lipase, which acts in the small intestine. Hydrochloric acid in gastric juice kills harmful microorganisms in food and provides the acidic pH for optimum stomach enzyme activity. Do not confuse physical chewing/emulsification with chemical hydrolysis.
- The small intestine is where nutrients are absorbed. Most water is absorbed there; some is absorbed from the colon. In an absorption question, distinguish soluble end-products crossing from the gut contents into blood (absorption) from the cells using them (assimilation). Principal water sources include drinks and water-rich foods. Complete the attached digestive-system and dentition practice views, then check the closed keys as well as the structure/function explanation.
What to do in an assessment
- For a food choice, connect the named nutrient with a source and its function; for deficiency, name the nutrient and condition. Do not claim a single food supplies a complete balanced diet.
- For digestion flow questions, keep the alimentary canal order separate from associated organs; connect each process word to its definition. Physical digestion increases surface area; chemical digestion changes large insoluble molecules into small soluble molecules.
- For enzymes, state substrate → enzyme/product, site of secretion and site of action where asked. For bile, mention fat emulsification and surface area; for hydrochloric acid, mention both pathogen killing and acidic optimum conditions.
- Use the attached schematic digestive-system and dentition diagrams for unlabelled practice and check their closed keys. Actual tooth-class image recognition is separately covered by the upper/lower occlusal model photos. Practise the named digestive organs on the labelled Blausen 3D image and pair it with the complete schematic/key for finer source targets.
In plain language
Food supplies nutrients; digestion makes small soluble molecules, the intestine absorbs them, and body cells assimilate them.
Self-check
A student chews bread into smaller pieces, then amylase acts on its starch. Which stage is physical, which is chemical, and why does the first help the second?
Show the answer
Chewing is physical digestion because it changes particle size without chemically changing food molecules. Amylase performs chemical digestion of starch. Smaller pieces provide greater surface area for enzyme action.
View diagrams
Human digestive systemSimplified schematic; not to scale. - A
- B
- C
- D
- E
- F
- G
- H
- I
- J
- K
- L
- M
Show labelled key: Answer key for digestive-system
Human digestive systemSimplified schematic; not to scale. - AMouth
- BOesophagus
- CLiver
- DGall bladder
- EStomach
- FPancreas
- GDuodenum
- HIleum
- IColon
- JRectum
- KAnus
- LSalivary glands
- MBile duct
Human dentitionSimplified schematic; not to scale. - A
- B
- C
- D
Show labelled key: Answer key for dentition
Human dentitionSimplified schematic; not to scale. - AIncisor
- BCanine
- CPremolar
- DMolar
Practise identifying alimentary organs and accessory organs in anatomical position, and all four human tooth types; check the separately keyed structures. - Course content
Scope: Course content · Subject-content route: Extended (Core and Supplement) · §3, Topic 7: §7.3 Supplement outcome 7; §7.4 Supplement outcomes 6(a)–(b), 7(a)–(b), 8; §7.5 Supplement outcomes 3–5.
Open revision guidance
What to know
- Bile emulsifies fats/oils into smaller droplets, increasing surface area available for lipase. Bile is alkaline and neutralises acidic food and gastric juice entering the duodenum from the stomach, creating a pH more suitable for intestinal enzyme action. Bile is not an enzyme and does not itself chemically digest fat.
- Starch digestion proceeds in two stages: amylase breaks starch to maltose; maltase on the membranes of the small-intestine epithelium breaks maltose to glucose. Protein digestion: pepsin breaks protein in the acidic stomach; trypsin breaks protein in the alkaline small intestine. Match enzyme, substrate/product and site precisely; the acidic stomach environment is not where trypsin acts.
- Villi and microvilli greatly increase the internal surface area of the small intestine, increasing area for absorption. A villus is a projection of the intestinal lining; it has a thin epithelial surface, a network of blood capillaries and a central lacteal. Capillaries take up water-soluble products such as glucose and amino acids and carry them in blood; the lacteal takes up absorbed fat products. This structure shortens the route into transport systems while providing a large exchange area.
- Worked self-check example: after a meal of starch and protein, starch is ultimately converted to glucose (amylase then maltase); protein is broken to amino acids (pepsin in stomach, then trypsin in alkaline small intestine). Glucose and amino acids enter villus capillaries; absorbed fat products enter lacteals. Bile supports fat digestion both by emulsifying droplets and neutralising acid in the duodenum.
What to do in an assessment
- For an enzyme-location table, give the enzyme, substrate, product and site: amylase—starch→maltose in digestive tract (including small intestine); maltase—maltose→glucose on small-intestine epithelium; pepsin—protein digestion in acidic stomach; trypsin—protein digestion in alkaline small intestine.
- For villus adaptation, connect projection/microvilli to large surface area, thin epithelium and capillaries/lacteal to rapid uptake and transport. Do not reverse the capillary and lacteal roles.
In plain language
Bile prepares fats and neutralises stomach acid; enzymes complete digestion, and villi provide routes for soluble products to enter blood or lymph.
Self-check
Why does the duodenum need bile when acidic stomach contents arrive, and what does emulsification add?
Show the answer
Alkaline bile neutralises the acidic mixture to provide a suitable pH for enzyme action. Emulsification divides fat into smaller droplets, increasing the surface area for lipase; neither action makes bile an enzyme.
Topic group
Transport in plants
- Course content
Scope: Course content · Subject-content route: any of Core, Extended (Core and Supplement) · §3, Topic 8, §§8.1–8.3, Core outcomes 1(a)–(b), 2; 8.2 outcomes 1–4; 8.3 outcomes 1–3.
Open revision guidance
What to know
- Xylem carries water and mineral ions from roots and also supports the plant; phloem transports sucrose and amino acids. In a non-woody dicot root, xylem is central and phloem lies between its arms; in a stem, xylem is toward the inside of each vascular bundle and phloem toward the outside; in a leaf vein, xylem is on the upper side and phloem below it. Practise locating both tissues in a labelled cross-section rather than identifying a bundle by position alone.
- A root hair cell is an epidermal cell with a long projection; its large surface area increases contact with soil water and dissolved mineral ions. Water passes from root-hair cells through root-cortex cells into xylem, travels up the stem, then enters leaf mesophyll cells. A stain experiment makes the route visible: place a freshly cut leafy shoot in coloured water, keep an unstained shoot as a comparison, then cut transverse sections of stem and leaf and record where colour appears.
- Transpiration is loss of water vapour from leaves. Water evaporates from moist mesophyll-cell surfaces into air spaces and diffuses out through stomata. A simple bubble potometer uses a water-filled capillary tube, reservoir and airtight shoot connections; it estimates water uptake, not water loss directly. Seal joints, cut the shoot under water, introduce one air bubble, allow equilibration, then measure bubble movement over a fixed time. Change one factor at a time, repeat, and keep leaf area and apparatus conditions constant.
- Worked stain result (illustrative classroom observation): put a freshly cut celery or leafy shoot in water coloured with food dye for 30 minutes; a matching shoot in clear water is the control. After cutting stem and leaf sections with teacher supervision, coloured xylem is visible in the stem and leaf veins while the control remains unstained. Infer that water travelled in xylem through above-ground parts of the plant. Use non-toxic food dye, do not eat plant material, and cut away from fingers.
- Worked potometer dataset (simulated means of three repeats, fixed 10-minute interval; bubble displacement in mm; same shoot leaf area, light and humidity): baseline 20°C/still air = 8 mm; 30°C/still air = 13 mm; 20°C/gentle fan = 12 mm. Temperature comparison is baseline versus 30°C; wind comparison is baseline versus fan. Greater uptake is consistent with faster transpiration but is not a direct water-loss measurement. Keep each change isolated, re-zero the bubble, repeat and compare means; teacher demonstration or supplied data is sufficient.
What to do in an assessment
- For a tissue-location question, orient the root/stem/leaf section first, then use the xylem/phloem positional pattern and annotate the evidence. For a water-pathway question, write the route in order: root hair → cortex → xylem → mesophyll.
- In a potometer comparison, state the changed factor, the measured bubble distance or rate, at least two controlled variables, repeats and a mean. Do not claim the apparatus directly measures transpiration.
In plain language
Roots absorb water, xylem carries it to leaves, and evaporation from leaves drives water loss; phloem carries dissolved food between plant regions.
Self-check
A stained shoot has coloured xylem but unstained cortex at the top of its stem. What does that show, and what further observation would support the route into a leaf?
Show the answer
The stain shows water moved into and along the xylem. A leaf section with stain in the vein xylem, followed by stained mesophyll near the vein, would support the onward route from xylem to leaf tissues.
View diagrams
Dicot leaf section · Unlabelled practice · Schematic, simplified and not to scale. Show labelled key: Answer key for leaf-section
Dicot leaf section · Structure key · Schematic, simplified and not to scale. Practice question
Read the section from its more regular, column-like tissue toward the looser tissue with larger spaces. Which leaf regions can you recognise, and where is the vein?
Photograph / micrograph recognition only. Species is not identified. This is a dicot example, but not a species-specific specimen.
Photo: Dicot leaf · Jon Houseman; source credit also names Matthew FordPhotomicrograph with a 0.2 mm scale bar.Show labelled key: Answer key for leaf-micrograph
Dicot leaf cross-section
Photo key
The source identifies this as a dicot leaf in transverse section. Elongated palisade tissue lies beneath the upper surface; looser spongy tissue with air spaces is toward the lower surface; a central vein is visible. Individual xylem and phloem are not resolved clearly enough here to label.
Species is not identified. This is a dicot example, but not a species-specific specimen.
Photo: Dicot leaf · Jon Houseman; source credit also names Matthew FordPhotomicrograph with a 0.2 mm scale bar.Non-woody dicot root section · Unlabelled practice · Schematic, simplified and not to scale. Show labelled key: Answer key for dicot-root-section
Non-woody dicot root section · Structure key · Schematic, simplified and not to scale. Non-woody dicot stem section · Unlabelled practice · Schematic, simplified and not to scale. Show labelled key: Answer key for dicot-stem-section
Non-woody dicot stem section · Structure key · Schematic, simplified and not to scale. Root-hair cell · Unlabelled practice · Schematic, simplified and not to scale. Show labelled key: Answer key for root-hair-cell
Root-hair cell · Structure key · Schematic, simplified and not to scale. 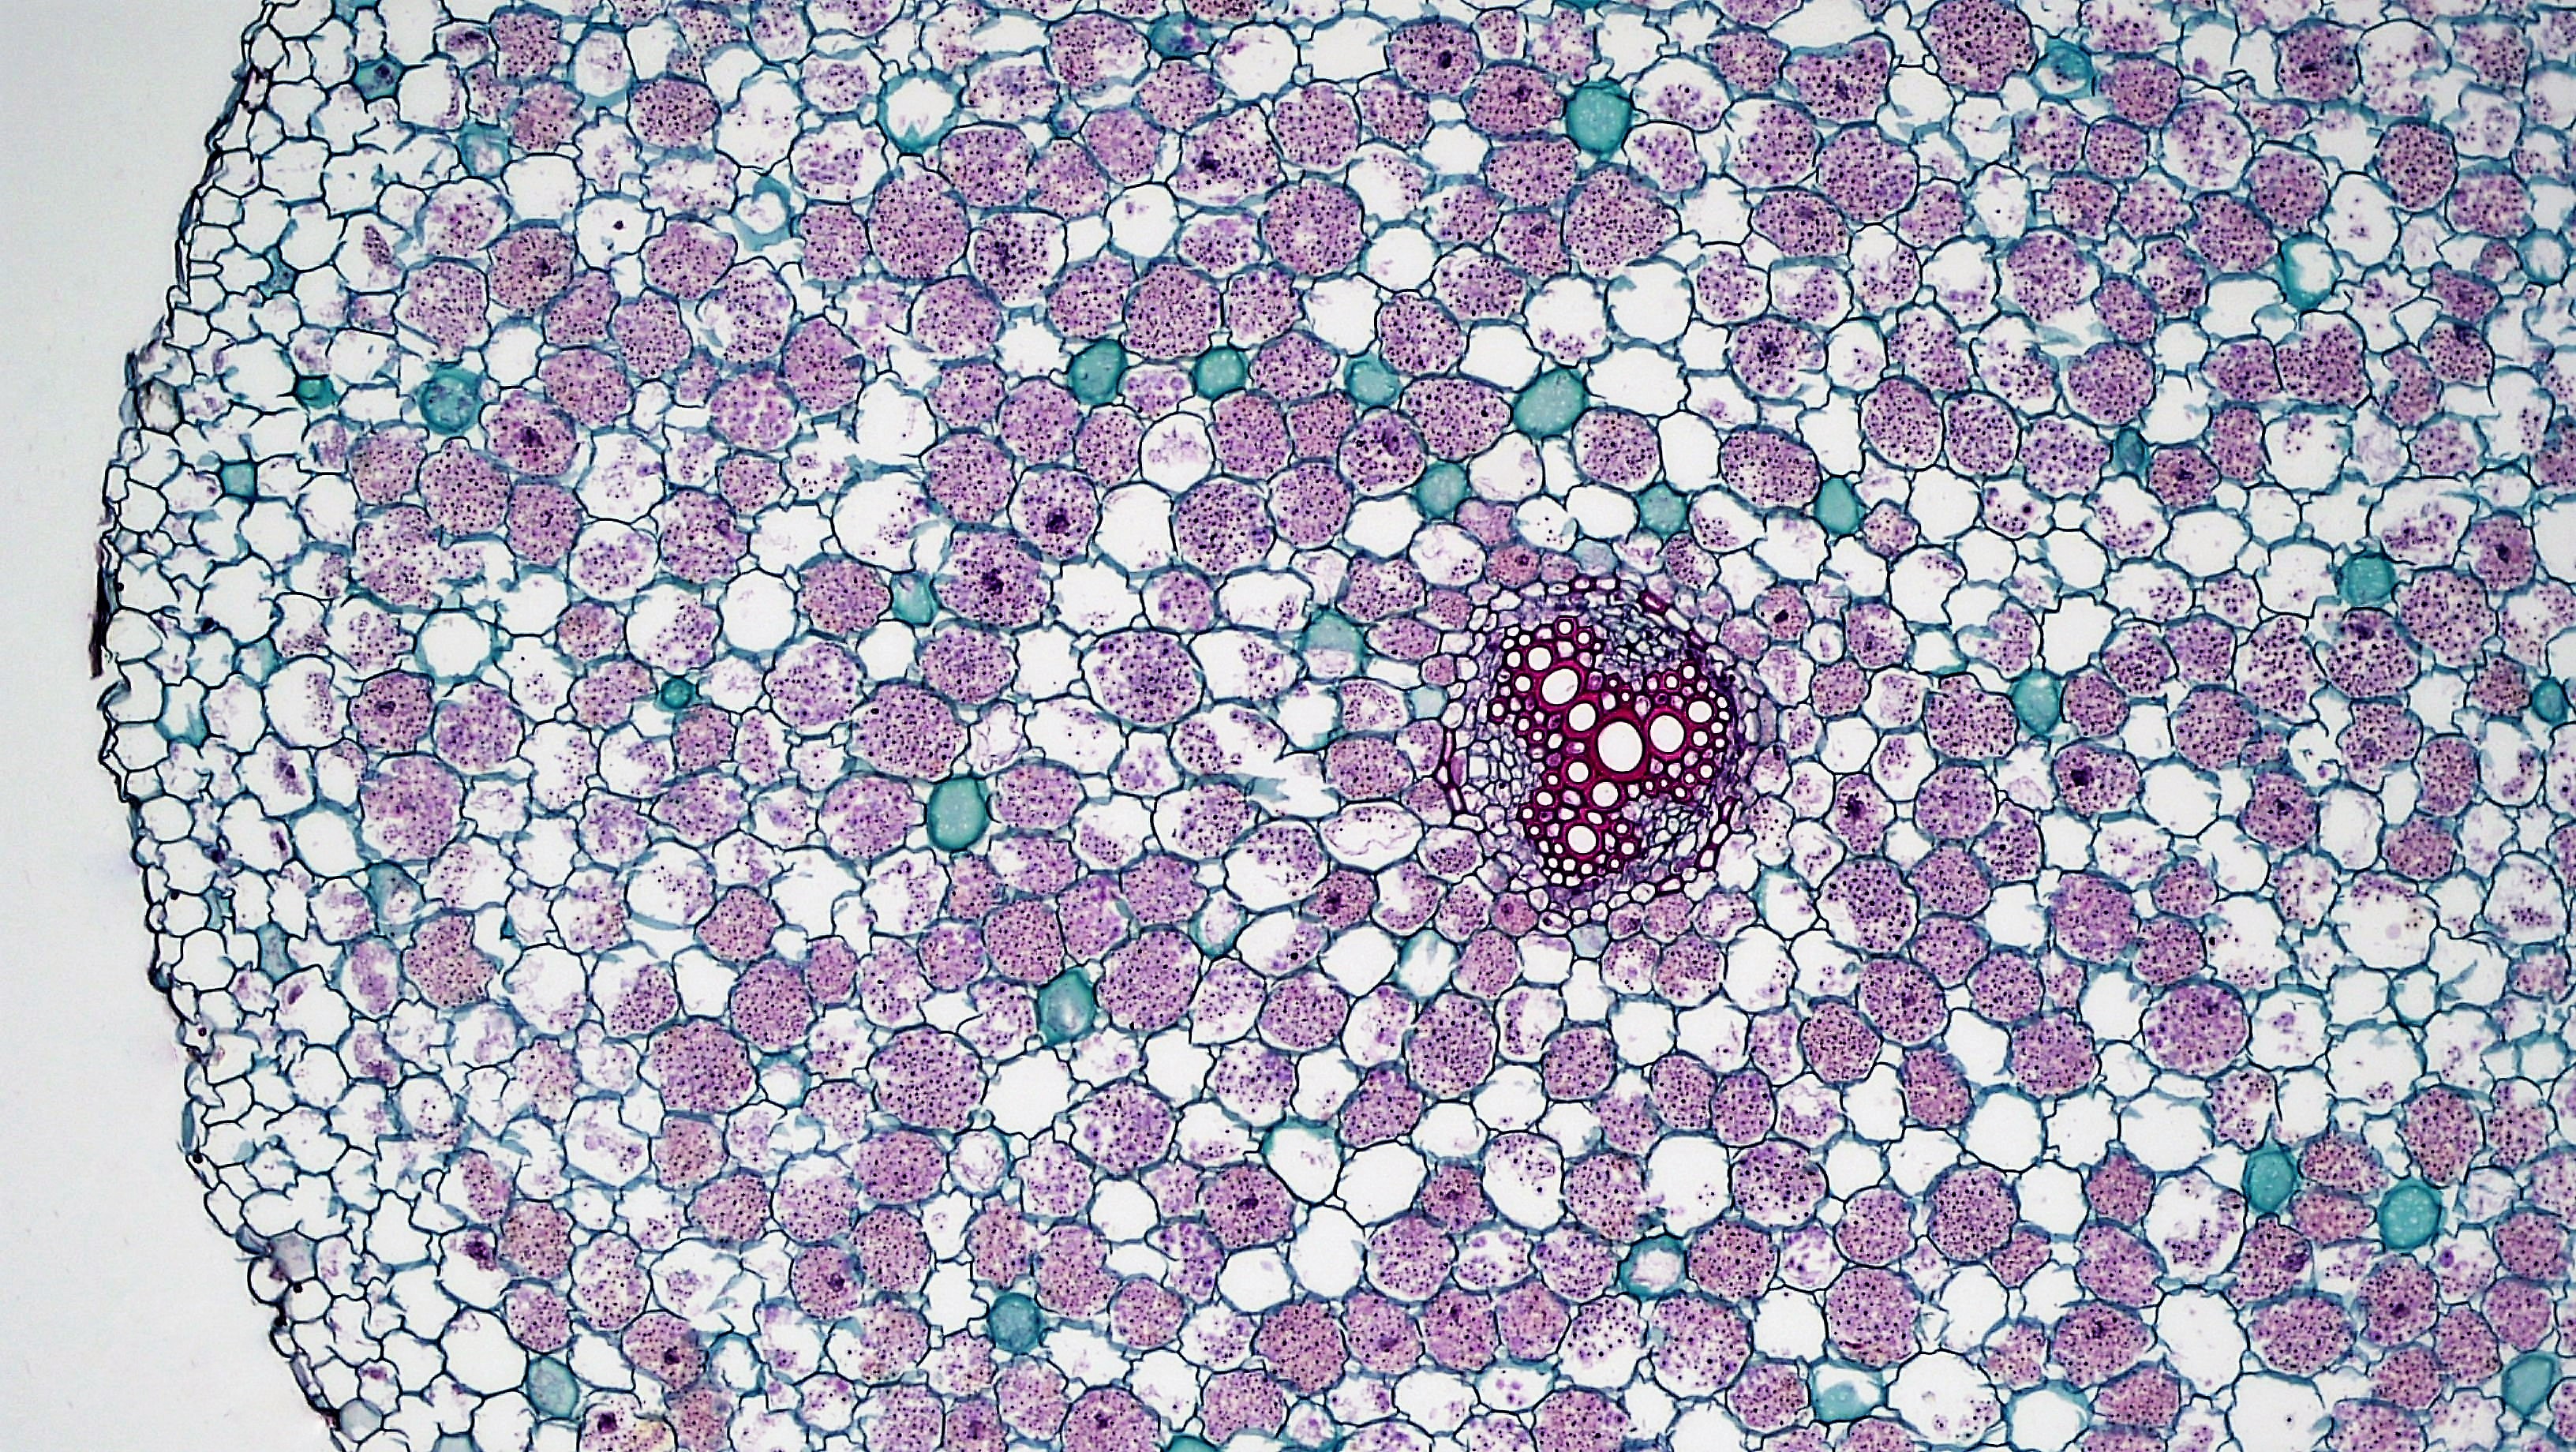
Enlarged view of the same central region
Practice question
Find the compact vascular region at the centre of the section. What arrangement can you recognise there, and how is it positioned relative to the surrounding tissue?
Photograph / micrograph recognition only. The full-frame centre is compact and the arms are easier to inspect in the enlargement below. No scale bar is shown (the source title gives 100×, not a specimen scale). This real specimen is a mature Ranunculus root; do not generalise its exact appearance to every root.
Photo: Herbaceous Dicot Root Mature Ranunculus (100x) · Berkshire Community College Bioscience Image LibrarySource page describes radial vascular bundles.Show labelled key: Answer key for root-micrograph
Mature Ranunculus root cross-section
Enlarged view of the same central region
Photo key
This is a mature Ranunculus (buttercup) root. The enlarged centre shows the vascular region: xylem forms central arms, with phloem between the arms. The photo is unlabelled; boundaries are not drawn on the specimen.
The full-frame centre is compact and the arms are easier to inspect in the enlargement below. No scale bar is shown (the source title gives 100×, not a specimen scale). This real specimen is a mature Ranunculus root; do not generalise its exact appearance to every root.
Photo: Herbaceous Dicot Root Mature Ranunculus (100x) · Berkshire Community College Bioscience Image LibrarySource page describes radial vascular bundles.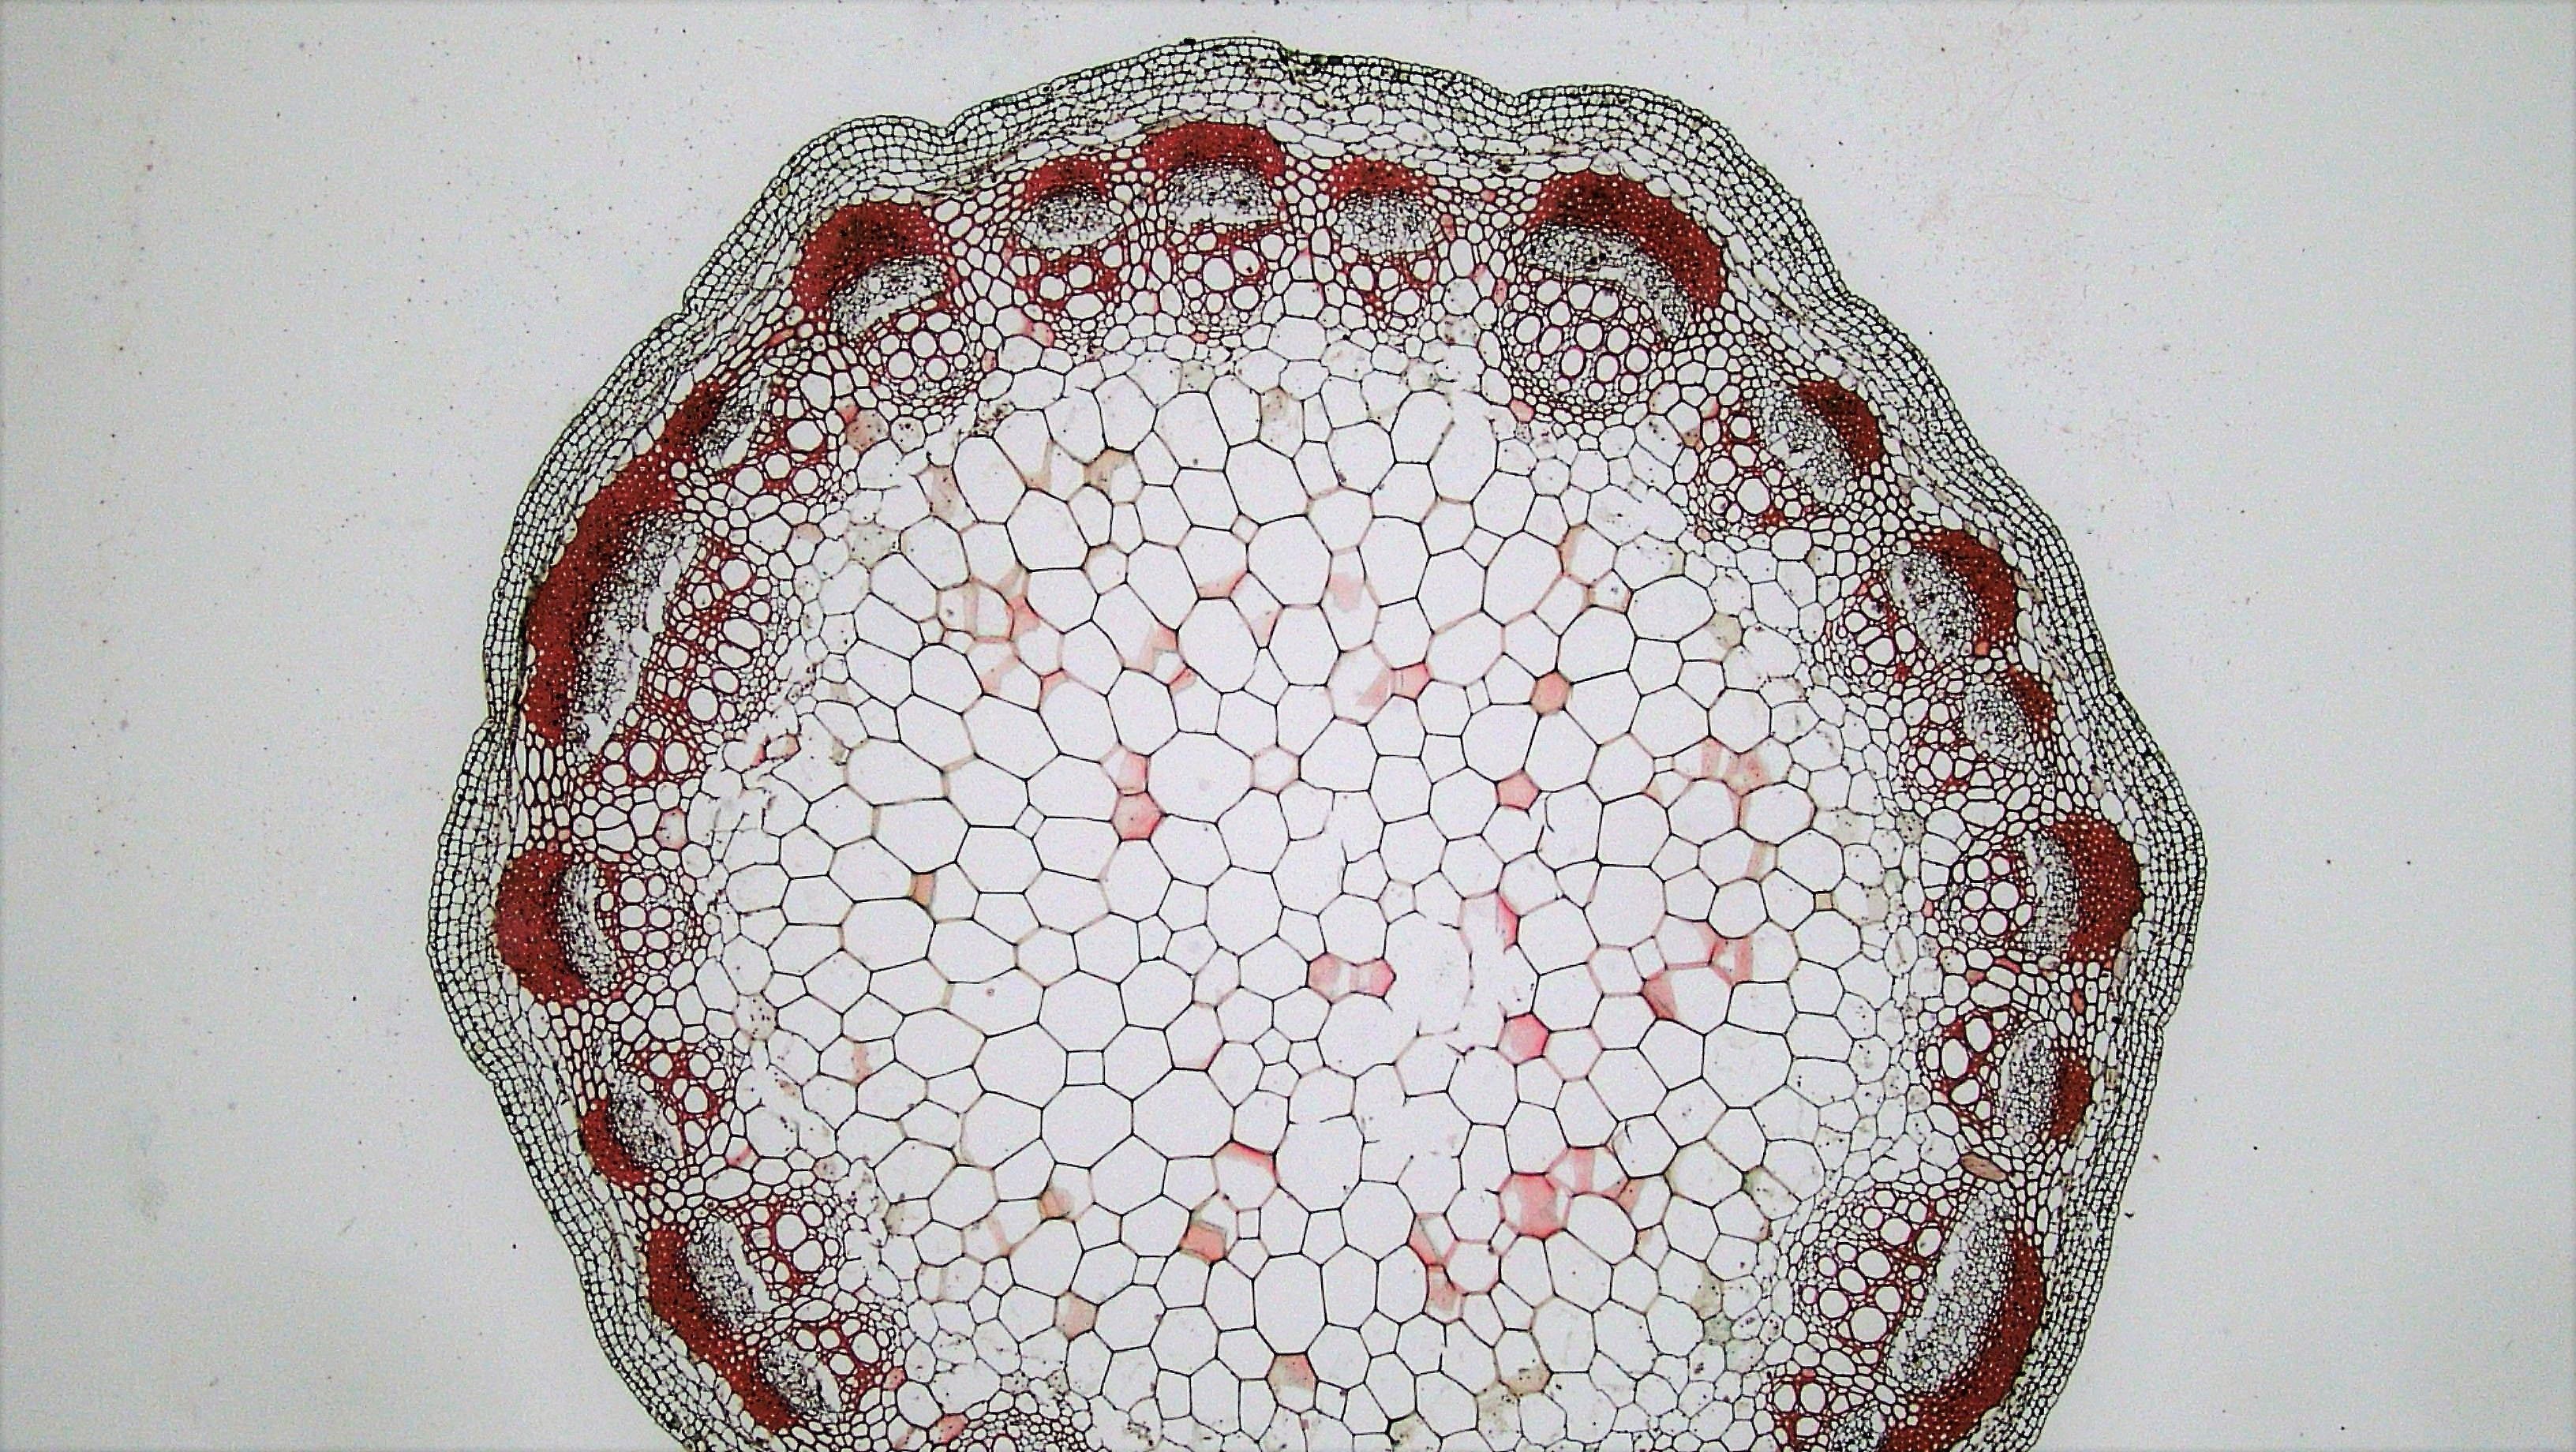
Practice question
Notice the repeated bundles around the outside of the section. What pattern do they make, and what occupies the broad middle?
Photograph / micrograph recognition only. The source identifies a young herbaceous dicot stem with primary vascular tissue. No scale bar is shown (the source title gives 40×, not a specimen scale). Individual xylem and phloem regions are not resolved well enough for a recognition label.
Photo: Herbaceous Dicot Stem Young Helianthus (40x) · Berkshire Community College Bioscience Image LibraryTransverse section of a young herbaceous dicot stem.Show labelled key: Answer key for stem-micrograph
Young Helianthus stem cross-section
Photo key
This is a young, herbaceous Helianthus (sunflower) dicot stem. Its vascular bundles form a ring near the outside, surrounding a large central pith. Individual xylem and phloem regions are too small to distinguish confidently in this unlabelled image; use a diagram for their relative positions within a bundle.
The source identifies a young herbaceous dicot stem with primary vascular tissue. No scale bar is shown (the source title gives 40×, not a specimen scale). Individual xylem and phloem regions are not resolved well enough for a recognition label.
Photo: Herbaceous Dicot Stem Young Helianthus (40x) · Berkshire Community College Bioscience Image LibraryTransverse section of a young herbaceous dicot stem.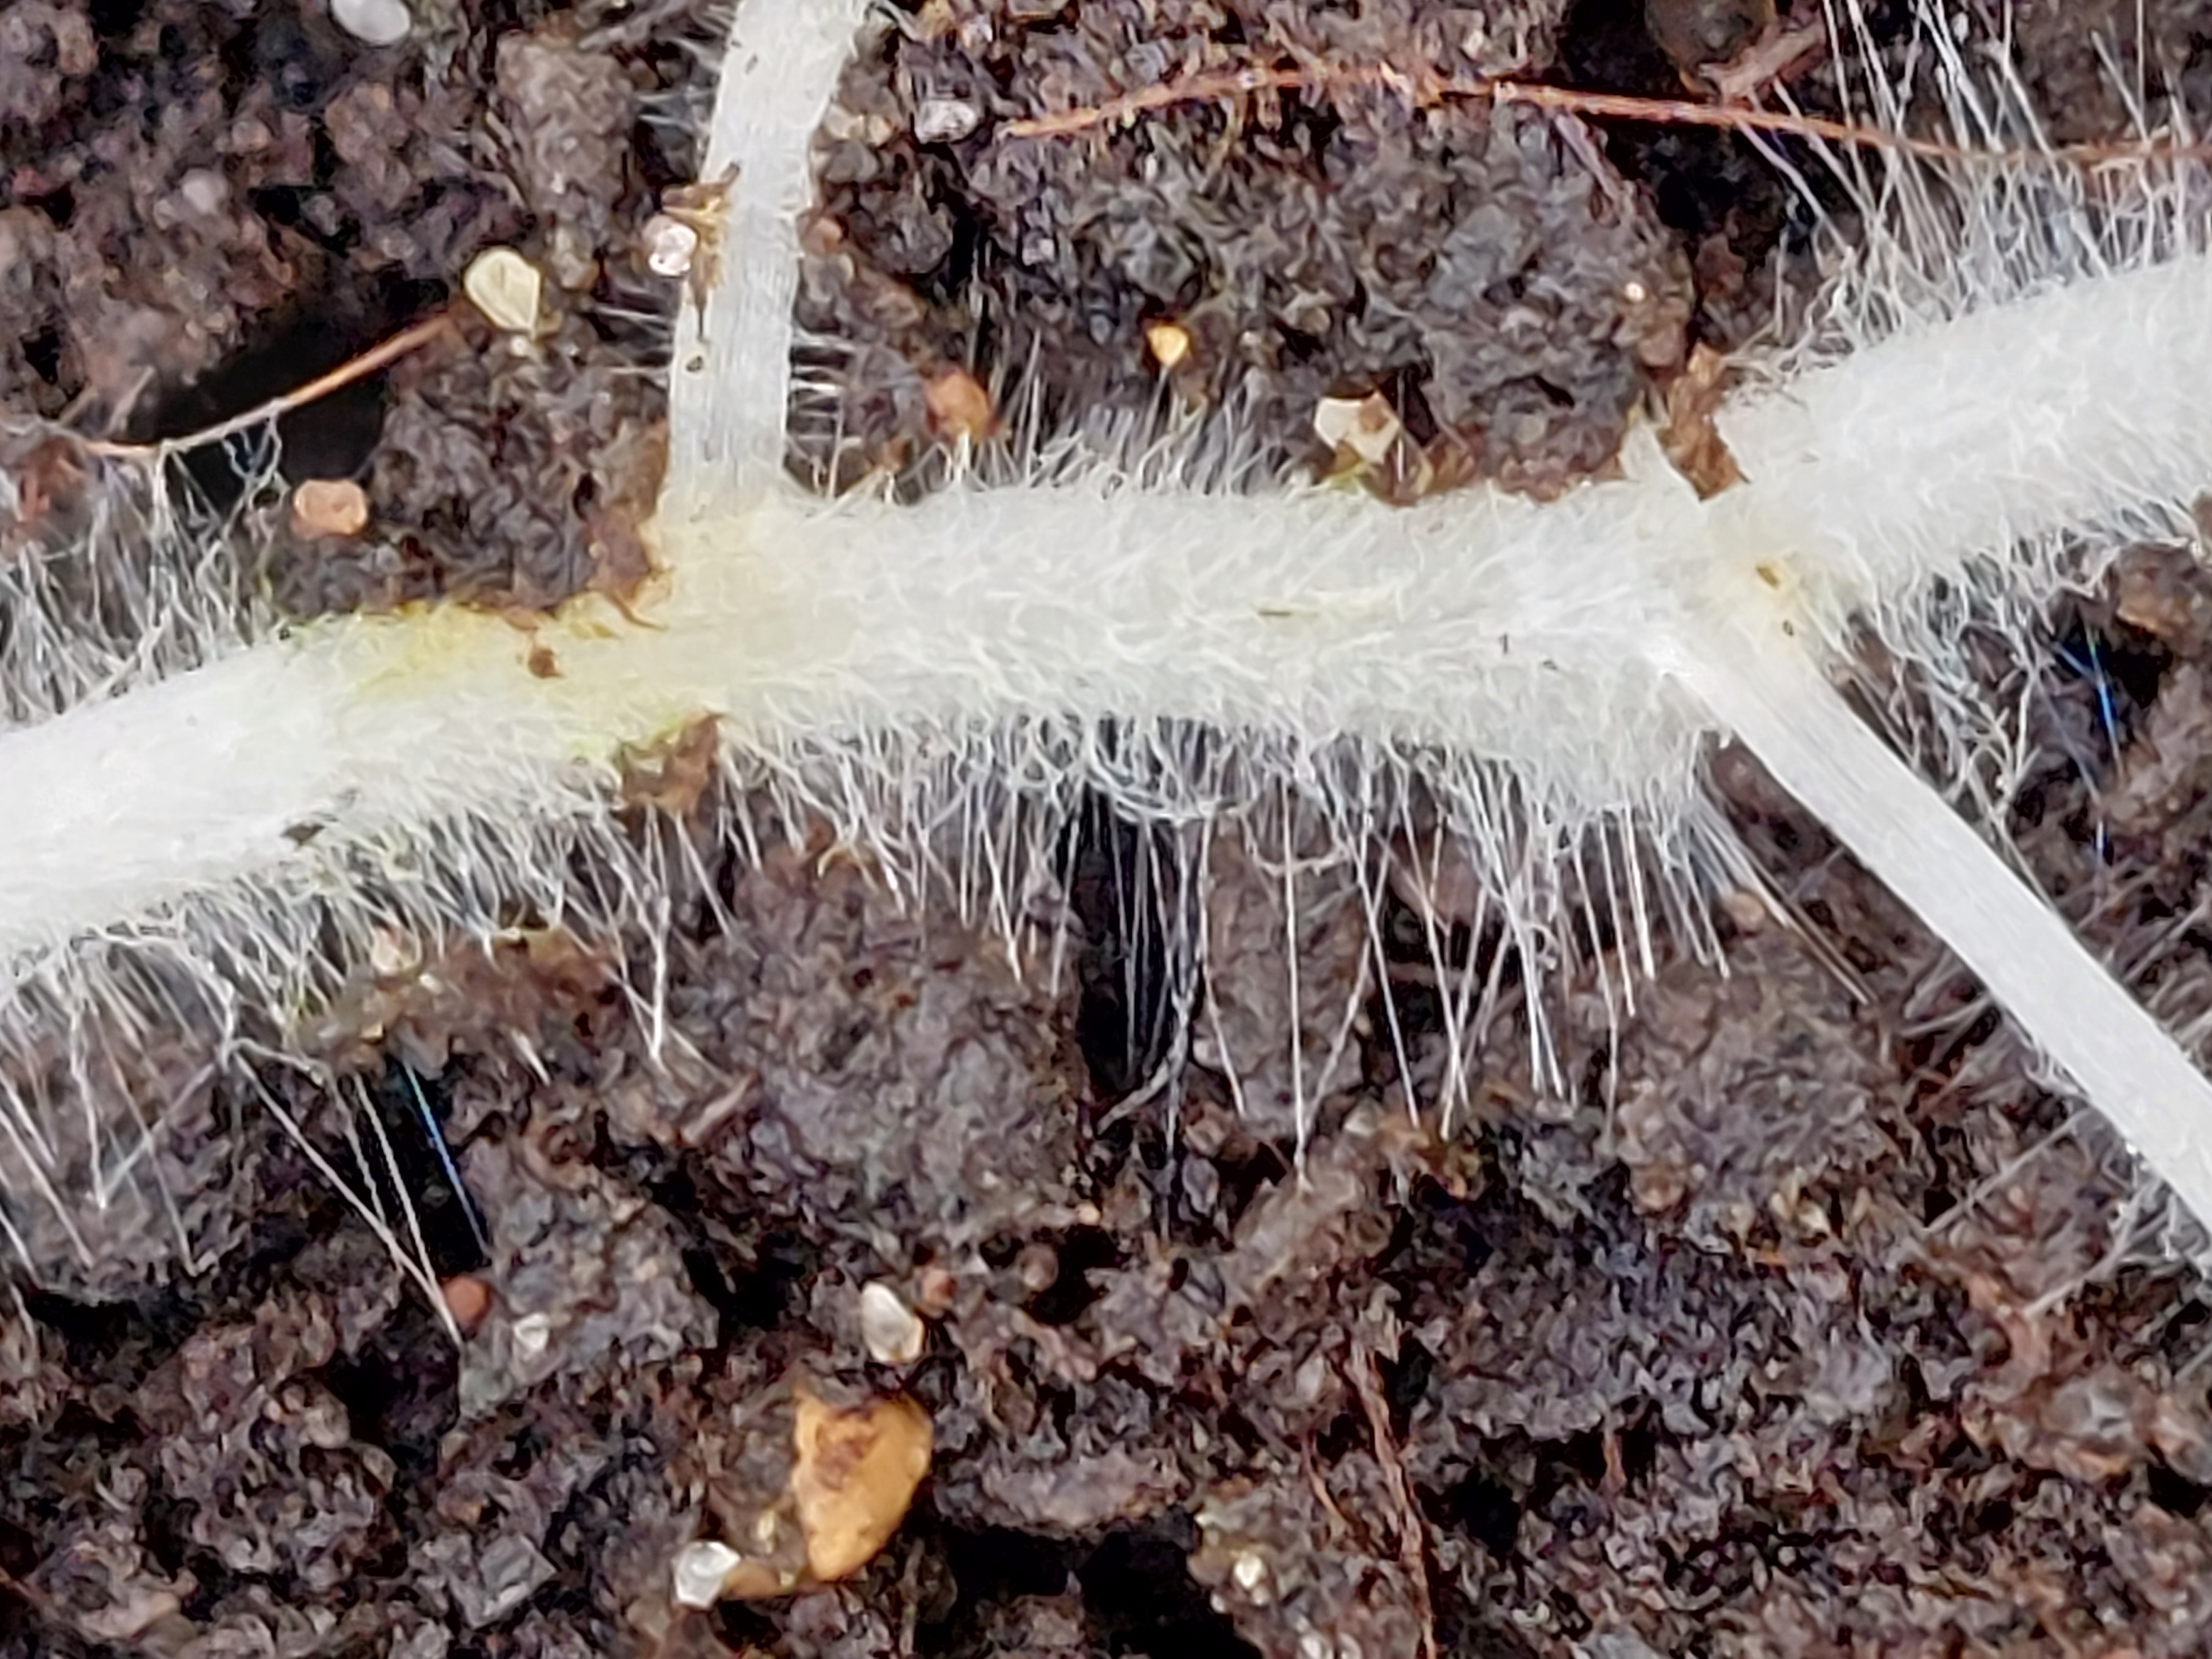
Practice question
What fine projections extend from the root surface into the surrounding soil? How might many such projections affect contact with soil water and dissolved mineral ions?
Photograph / micrograph recognition only. This macro photograph shows numerous root hairs against soil, not the internal structure or boundary of one individual root-hair cell. No scale is provided.
Photo: Cucurbita maxima root hairs · Josef SchlagheckenClose-up photograph; no scale provided.Show labelled key: Answer key for root-hair-photo
Cucurbita maxima root hairs
Photo key
The fine projections are root hairs. They are extensions of root epidermal cells; their large combined surface area increases contact with soil water and dissolved mineral ions.
This macro photograph shows numerous root hairs against soil, not the internal structure or boundary of one individual root-hair cell. No scale is provided.
Photo: Cucurbita maxima root hairs · Josef SchlagheckenClose-up photograph; no scale provided.Compare diagram and authentic leaf, root and stem sections for vascular positions, then identify root-hair cell structure and compare with the external root-hair macrophoto; do not infer invisible interiors. - Course content
Scope: Course content · Subject-content route: Extended (Core and Supplement) · §3, Topic 8, §8.1 Supplement outcome 3(a)–(c); §8.3 outcomes 4–7; §8.4 outcomes 1, 2(a)–(b), 3.
Open revision guidance
What to know
- Xylem vessels conduct water and mineral ions and help support the plant: lignin thickens their walls, the conducting elements have no cell contents, and cells join end-to-end without cross-walls to form a continuous tube. Lignified thick walls strengthen the plant and resist collapse; empty vessel elements joined into one continuous tube provide an unobstructed water pathway. In a transpiring leaf, evaporation from mesophyll surfaces and diffusion through stomata lower water potential in the leaf; cohesion between water molecules keeps the xylem water column together as transpiration pull draws it upward.
- Water-vapour loss depends on the large internal mesophyll surface exposed to connected air spaces and on stomatal number and size. Higher temperature generally speeds evaporation and diffusion; moving air removes humid air near the leaf and usually increases loss; higher humidity reduces the water-vapour gradient and slows loss. Wilting occurs when water loss exceeds uptake: cells lose turgor, so leaves and stems become limp.
- Translocation is movement of sucrose and amino acids in phloem from sources (parts releasing them) to sinks (parts using or storing them). A mature photosynthesising leaf is commonly a sucrose source; a growing shoot, root, fruit or storage organ is a sink. The same storage organ can change role: a tuber stores sucrose in one season but releases it to growing shoots later. These are source–sink roles, not fixed tissue labels.
What to do in an assessment
- When explaining a transpiration-rate graph, trace the factor to the water-vapour gradient or evaporation/diffusion step, then state the predicted direction. For wilting, connect net water loss to reduced cell turgor.
- For source/sink scenarios, identify whether the tissue is releasing or using/storing sucrose or amino acids at that time; do not label a plant organ as permanently one or the other.
In plain language
The pull from evaporating water draws a cohesive water column through xylem; phloem redistributes soluble food from current sources to current sinks.
Self-check
A plant is moved from still, humid air to warm, dry, moving air. Predict the transpiration change and explain two causes.
Show the answer
Transpiration is expected to increase: warmth speeds evaporation, while moving dry air maintains a steep water-vapour gradient at the leaf surface. (The prediction assumes other factors, such as light and stomatal state, are unchanged.)
Topic group
Transport in animals
- Course content
Scope: Course content · Subject-content route: any of Core, Extended (Core and Supplement) · §3, Topic 9, §§9.1–9.4, Core outcomes 1; 9.2 outcomes 1–6; 9.3 outcomes 1–3(a)–(c); 9.4 outcomes 1–4, including 9.4 outcome 3(a)–(d).
Open revision guidance
What to know
- A circulatory system has a pump, blood vessels and valves that maintain one-way blood flow. The heart has four chambers separated by a septum; identify the atria above the ventricles, the one-way valves between chambers/at exits, and the coronary arteries on the heart surface. Arteries carry blood away from the heart, veins return it, and capillaries connect small vessels in tissues. Trace: vena cava → right heart → pulmonary artery → lungs → pulmonary vein → left heart → aorta → body; renal artery and renal vein serve the kidney.
- Arteries have thicker walls than veins, reflecting higher pressure; veins have a larger lumen and valves to prevent backflow at lower pressure. Capillaries have very thin walls and a narrow lumen. They exchange materials between blood and tissues. Blood comprises red cells, white cells, platelets and plasma: haemoglobin in red cells carries oxygen; white cells carry out phagocytosis and antibody production; platelets aid clotting; plasma carries cells, ions, nutrients, urea, hormones and carbon dioxide. Clotting prevents blood loss and pathogen entry.
- Coronary heart disease is associated with blockage of coronary arteries. Risk factors include diet, inactivity, stress, smoking, genetic predisposition, age and sex; balanced diet and regular exercise can reduce risk. Heart activity may be monitored by ECG, pulse rate or listening to valve sounds. For an exercise investigation, use the same pulse-count interval and posture, record a resting value, use a defined activity duration/intensity, measure immediately and at recovery intervals, repeat safely, and compare.
- Worked safe-classroom pulse example (simulated teacher-provided data): count a radial pulse for 15 seconds and multiply by four; one-minute low-intensity stepping gives 72 beats/min at rest, 118 immediately after, and 82 after three minutes' recovery. The rise after activity and fall during recovery fit increased cardiac output during exercise. If a practical is done, teacher supervision, participant choice, a low step, a clear stop rule for discomfort and no pressure to exercise are required; otherwise analyse the supplied dataset.
What to do in an assessment
- On a heart or vessel diagram, trace the path with arrows and label each vessel by direction and destination before stating oxygenation; do not infer oxygenation from artery/vein names.
- Compare vessel sections using wall thickness, lumen size and valves, linking each feature to pressure or flow. In data questions, compare pulse rate with a clear baseline and identify whether the measurement is at rest, immediately after activity or during recovery.
In plain language
The heart pumps blood through vessels; blood transports materials, exchanges them with tissues and helps defend the body.
Self-check
A blood vessel has a thin wall, a wide lumen and valves. Identify it and explain why its valves matter.
Show the answer
It is a vein. Blood in veins is at relatively low pressure, so valves prevent backflow and help maintain return toward the heart.
View diagrams
Section through the human heartSimplified schematic; not to scale. - A
- B
- C
- D
- E
- F
- G
- H
- I
- J
- K
- L
- M
- N
Show labelled key: Answer key for heart-section
Section through the human heartSimplified schematic; not to scale. - ARight atrium
- BRight ventricle
- CLeft atrium
- DLeft ventricle
- ESeptum
- FMuscular wall
- GTricuspid valve
- HBicuspid (mitral) valve
- ISemilunar valves
- JCoronary arteries
- KVena cava
- LPulmonary artery
- MPulmonary vein
- NAorta
Double circulation and major vesselsColour indicates oxygenation, not artery or vein type. Simplified schematic; not to scale. - A
- B
- C
- D
- E
- F
- G
- H
- I
- J
- K
- L
- M
- N
Show labelled key: Answer key for circulation-vessels
Double circulation and major vesselsColour indicates oxygenation, not artery or vein type. Simplified schematic; not to scale. - AHeart
- BLungs
- CPulmonary artery: heart → lungs
- DPulmonary vein: lungs → heart
- EAorta: away from heart
- FVena cava: to heart
- GGut
- HHepatic portal vein: gut → liver
- ILiver
- JHepatic artery: to liver
- KHepatic veins: from liver
- LKidney
- MRenal artery: to kidney
- NRenal vein: from kidney
Blood cells: schematic, not a photomicrographSchematic shapes only. Actual representative photomicrographs must be supplied separately; this drawing is not a specimen. - A
- B
- C
- D
- E
- F
Show labelled key: Answer key for blood-cells
Blood cells: schematic, not a photomicrographSchematic shapes only. Actual representative photomicrographs must be supplied separately; this drawing is not a specimen. - ARed blood cell: biconcave, no nucleus
- BPhagocyte
- CPhagocyte nucleus
- DLymphocyte
- ELymphocyte nucleus
- FPlatelets
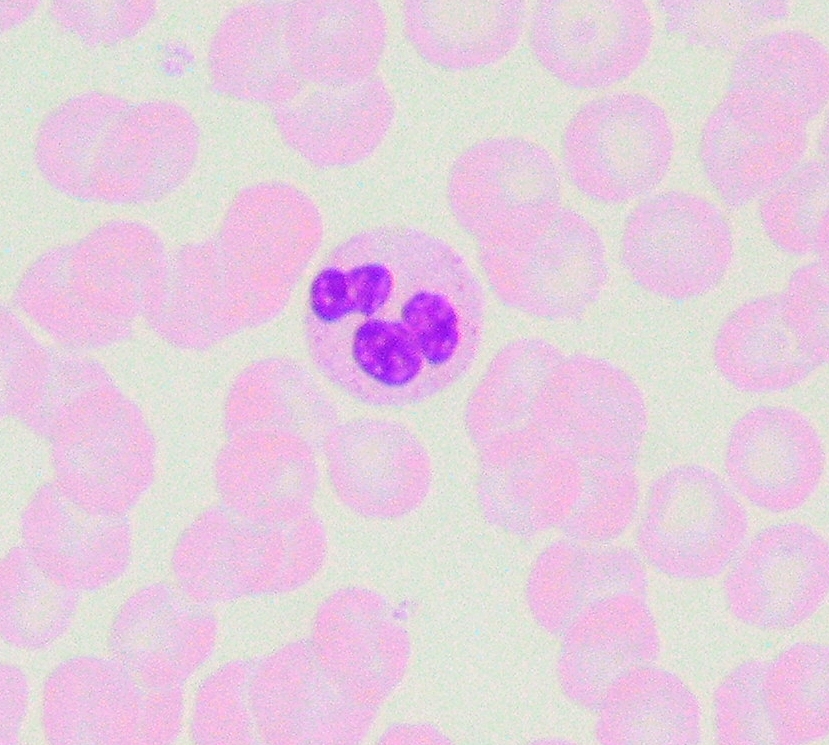
Practice question
Compare the many pale disc-shaped cells with the larger purple-stained cell near the centre. Which is the red blood cell type, and what kind of white blood cell is visible?
Photograph / micrograph recognition only. This small unlabelled field contains erythrocytes and a neutrophil, not a lymphocyte. No scale bar is shown.
Photo: Blood-neutrophil1 · EchinaceapallidaWright-stained human peripheral blood smear.Show labelled key: Answer key for blood-smear-micrograph
Human blood smear
Photo key
The numerous pale cells are erythrocytes (red blood cells). The larger purple-stained cell is a neutrophil, identified by its segmented nucleus.
This small unlabelled field contains erythrocytes and a neutrophil, not a lymphocyte. No scale bar is shown.
Photo: Blood-neutrophil1 · EchinaceapallidaWright-stained human peripheral blood smear.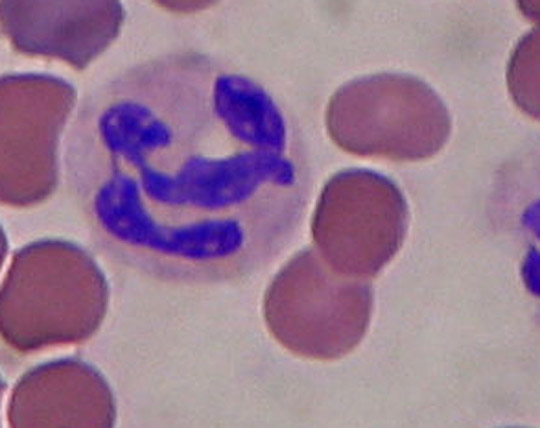
Practice question
Inspect the prominent purple-stained white blood cell. What shape does its dark-stained nucleus have?
Photograph / micrograph recognition only. Small, tightly framed micrograph; only part of the surrounding smear is visible. No scale bar or specimen scale is given.
Photo: Neutrophil in a blood smear · Original image: hematologist (Segmented_neutrophils.jpg); derivative work: patient-docDerivative image; source page credits the original image and derivative work.Show labelled key: Answer key for neutrophil-micrograph
Neutrophil in a blood smear
Photo key
It is a neutrophil. The visible nucleus is segmented into several lobes; nearby erythrocytes provide context, not a scale reference.
Small, tightly framed micrograph; only part of the surrounding smear is visible. No scale bar or specimen scale is given.
Photo: Neutrophil in a blood smear · Original image: hematologist (Segmented_neutrophils.jpg); derivative work: patient-docDerivative image; source page credits the original image and derivative work.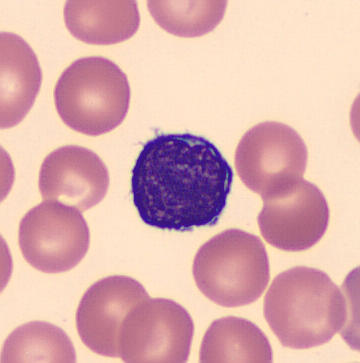
Practice question
Compare the lymphocyte with the surrounding red blood cells. What can you observe about its dark central region and the amount of cytoplasm around it?
Photograph / micrograph recognition only. The image does not include a scale bar. No donor health status or diagnosis is provided by the source.
Show labelled key: Answer key for lymphocyte-micrograph
Lymphocyte in a human blood smear
Photo key
The cell is a human lymphocyte. It has a prominent, rounded dark nucleus and a narrow rim of cytoplasm. The source does not identify the donor’s health status.
The image does not include a scale bar. No donor health status or diagnosis is provided by the source.
Practise heart orientation/chambers/valves, systemic and pulmonary vessel routes, and blood-cell identification; compare diagrams with separate authentic smear, neutrophil and lymphocyte micrographs. - Course content
Scope: Course content · Subject-content route: Extended (Core and Supplement) · §3, Topic 9, §9.1 Supplement outcomes 2–4; §9.2 outcomes 7–11; §9.3 outcomes 4–6; §9.4 outcomes 5, 6(a)–(b), 7.
Open revision guidance
What to know
- Fish have single circulation: heart → gills → body → heart, so blood passes through the heart once per complete circuit. Mammals have double circulation: right heart → lungs → left heart → body → right heart. This keeps pulmonary and systemic circuits distinct and allows blood to be pumped again before the body circuit.
- The left ventricle has the thickest muscular wall because it pumps at high pressure around the body; the right ventricle pumps only to the lungs. Atria have thinner walls because they push blood only into ventricles. The septum prevents mixing of oxygenated and deoxygenated blood. Atrial contraction pushes blood into ventricles; ventricular contraction closes atrioventricular valves and opens semilunar valves, ejecting blood. Relaxation lets the chambers refill and valves prevent reverse flow. Exercise raises heart rate to increase delivery of oxygen and glucose to respiring muscles and removal of carbon dioxide.
- Arterial elastic, muscular walls withstand and smooth high-pressure pulses; veins return lower-pressure blood through a wide lumen and valves. Capillary walls are one cell thick and close to cells, supporting short diffusion distances; their networks provide a large exchange area. The hepatic artery brings oxygenated blood to the liver, hepatic veins carry blood away, and the hepatic portal vein brings nutrient-rich blood from the gut. Lymphocytes make antibodies, while phagocytes engulf pathogens by phagocytosis. During clotting, soluble fibrinogen is converted to insoluble fibrin threads that form a mesh trapping blood cells.
What to do in an assessment
- For a circulation comparison, draw each circuit as an ordered arrow chain and count heart passages in one full circuit. For valve questions, state which chamber is contracting and the resulting valve state/direction of flow.
- For vessel-function questions, connect wall/lumen/valve evidence to the pressure and task. Distinguish hepatic artery, hepatic vein and hepatic portal vein by destination/source, not just by the word 'liver'.
In plain language
Double circulation separates lung and body flow, while heart and vessel structures control pressure and exchange; blood cells and fibrin support defence and clotting.
Self-check
Why does blood pass through the heart twice in a mammal's complete circuit, and why is the left ventricle stronger than the right?
Show the answer
The two passages separate pulmonary and systemic circuits and restore pressure after the lungs before blood travels around the body. The left ventricle needs a thicker muscular wall to generate the higher systemic pressure; the right pumps only to the nearby lungs.
View diagrams
Section through the human heartSimplified schematic; not to scale. - A
- B
- C
- D
- E
- F
- G
- H
- I
- J
- K
- L
- M
- N
Show labelled key: Answer key for heart-section
Section through the human heartSimplified schematic; not to scale. - ARight atrium
- BRight ventricle
- CLeft atrium
- DLeft ventricle
- ESeptum
- FMuscular wall
- GTricuspid valve
- HBicuspid (mitral) valve
- ISemilunar valves
- JCoronary arteries
- KVena cava
- LPulmonary artery
- MPulmonary vein
- NAorta
Double circulation and major vesselsColour indicates oxygenation, not artery or vein type. Simplified schematic; not to scale. - A
- B
- C
- D
- E
- F
- G
- H
- I
- J
- K
- L
- M
- N
Show labelled key: Answer key for circulation-vessels
Double circulation and major vesselsColour indicates oxygenation, not artery or vein type. Simplified schematic; not to scale. - AHeart
- BLungs
- CPulmonary artery: heart → lungs
- DPulmonary vein: lungs → heart
- EAorta: away from heart
- FVena cava: to heart
- GGut
- HHepatic portal vein: gut → liver
- ILiver
- JHepatic artery: to liver
- KHepatic veins: from liver
- LKidney
- MRenal artery: to kidney
- NRenal vein: from kidney
Blood cells: schematic, not a photomicrographSchematic shapes only. Actual representative photomicrographs must be supplied separately; this drawing is not a specimen. - A
- B
- C
- D
- E
- F
Show labelled key: Answer key for blood-cells
Blood cells: schematic, not a photomicrographSchematic shapes only. Actual representative photomicrographs must be supplied separately; this drawing is not a specimen. - ARed blood cell: biconcave, no nucleus
- BPhagocyte
- CPhagocyte nucleus
- DLymphocyte
- ELymphocyte nucleus
- FPlatelets
Practice question
Compare the many pale disc-shaped cells with the larger purple-stained cell near the centre. Which is the red blood cell type, and what kind of white blood cell is visible?
Photograph / micrograph recognition only. This small unlabelled field contains erythrocytes and a neutrophil, not a lymphocyte. No scale bar is shown.
Photo: Blood-neutrophil1 · EchinaceapallidaWright-stained human peripheral blood smear.Show labelled key: Answer key for blood-smear-micrograph
Human blood smear
Photo key
The numerous pale cells are erythrocytes (red blood cells). The larger purple-stained cell is a neutrophil, identified by its segmented nucleus.
This small unlabelled field contains erythrocytes and a neutrophil, not a lymphocyte. No scale bar is shown.
Photo: Blood-neutrophil1 · EchinaceapallidaWright-stained human peripheral blood smear.Practice question
Inspect the prominent purple-stained white blood cell. What shape does its dark-stained nucleus have?
Photograph / micrograph recognition only. Small, tightly framed micrograph; only part of the surrounding smear is visible. No scale bar or specimen scale is given.
Photo: Neutrophil in a blood smear · Original image: hematologist (Segmented_neutrophils.jpg); derivative work: patient-docDerivative image; source page credits the original image and derivative work.Show labelled key: Answer key for neutrophil-micrograph
Neutrophil in a blood smear
Photo key
It is a neutrophil. The visible nucleus is segmented into several lobes; nearby erythrocytes provide context, not a scale reference.
Small, tightly framed micrograph; only part of the surrounding smear is visible. No scale bar or specimen scale is given.
Photo: Neutrophil in a blood smear · Original image: hematologist (Segmented_neutrophils.jpg); derivative work: patient-docDerivative image; source page credits the original image and derivative work.Practice question
Compare the lymphocyte with the surrounding red blood cells. What can you observe about its dark central region and the amount of cytoplasm around it?
Photograph / micrograph recognition only. The image does not include a scale bar. No donor health status or diagnosis is provided by the source.
Show labelled key: Answer key for lymphocyte-micrograph
Lymphocyte in a human blood smear
Photo key
The cell is a human lymphocyte. It has a prominent, rounded dark nucleus and a narrow rim of cytoplasm. The source does not identify the donor’s health status.
The image does not include a scale bar. No donor health status or diagnosis is provided by the source.
Practise heart orientation/chambers/valves, systemic and pulmonary vessel routes, and blood-cell identification; compare diagrams with separate authentic smear, neutrophil and lymphocyte micrographs.
Topic group
Diseases and immunity
- Course content
Scope: Course content · Subject-content route: any of Core, Extended (Core and Supplement) · §3, Topic 10, §10.1, Core outcomes 1–5, including outcome 3(a)–(b) and outcome 5(a)–(e).
Open revision guidance
What to know
- A pathogen is a disease-causing organism. A transmissible disease is one whose pathogen can pass from one host to another. Transmission may be direct, including blood and other body fluids, or indirect from contaminated surfaces, food, animals or air. Link the route to a control: clean water and sewage treatment interrupt water-borne spread; hygienic food preparation and hand hygiene limit faecal–oral transfer; safe waste disposal removes sources of contamination.
- The body's first-line physical and chemical defences include skin, hairs in the nose, mucus and stomach acid; white blood cells defend against pathogens. Explain prevention by breaking a specific link in transmission rather than listing measures without a route. For example, safe drinking water prevents ingestion of water contaminated with an enteric pathogen, while covering a cough reduces droplets reaching another host.
What to do in an assessment
- In an unfamiliar disease scenario, identify the source and route first, then choose the measure that blocks that route. Distinguish direct contact from indirect transfer via an intermediate such as a surface, food, animal or air.
In plain language
Pathogens cause disease and spread between hosts; body barriers and sanitation reduce the chance of transmission.
Self-check
A community has repeated disease after drinking from a contaminated well. Name two different controls and explain how each interrupts transmission.
Show the answer
Provide a clean treated water supply so the pathogen is not ingested, and safely dispose of waste/sewage so contamination does not reach the well. Each removes a link between the pathogen source and the next host.
- Course content
Scope: Course content · Subject-content route: Extended (Core and Supplement) · §3, Topic 10, §10.1, Supplement outcomes 6–17, including outcome 11(a)–(c).
Open revision guidance
What to know
- Active immunity is defence made by the person's own antibody production. Each pathogen has its own specifically shaped antigens; antibodies are proteins with complementary shapes that bind those antigens. Binding may directly destroy pathogens or mark them for destruction by phagocytes. After infection or vaccination, lymphocytes respond and memory cells remain, so later exposure can trigger a faster response.
- Vaccination introduces weakened pathogens or their antigens. These stimulate lymphocytes to make specific antibodies and memory cells, providing long-term active immunity. High vaccination coverage reduces the number of susceptible hosts and therefore the opportunities for transmission, helping protect both vaccinated people and the wider population. Passive immunity instead transfers ready-made antibodies from another individual: across the placenta or in breast milk. It acts quickly but is short-term, and the recipient makes no memory cells; breast-feeding can therefore provide infants temporary antibody protection.
- Cholera is caused by a bacterium transmitted in contaminated water. Its toxin causes chloride ions to be secreted into the small intestine; water follows by osmosis into the gut, causing diarrhoea. The resulting loss of water dehydrates the person and the loss of ions disrupts blood composition. In an explanation, keep the causal sequence complete: toxin → chloride secretion → osmotic water movement → diarrhoea → dehydration and ion loss.
What to do in an assessment
- When comparing immunity, identify the source of antibodies, whether the person's lymphocytes made them, how long protection lasts and whether memory cells form. Do not call transferred maternal antibodies vaccination or active immunity.
- For vaccination questions, give the antigen stimulus, lymphocyte antibody response, memory-cell outcome and population-level effect in order. For cholera, use the full ion/osmosis chain rather than saying the toxin simply 'causes diarrhoea'.
In plain language
Active immunity trains a person's own immune system and can leave memory; passive immunity lends antibodies temporarily. Vaccination limits spread, while cholera toxin drives intestinal water loss.
Self-check
A vaccinated person meets the same pathogen months later. Explain why protection can be faster than the first response, and contrast this with antibodies received through breast milk.
Show the answer
Vaccination has produced memory cells; on re-exposure these cells enable a faster antibody response. Breast milk transfers antibodies made by another individual, giving temporary passive protection without producing the infant's memory cells.
Topic group
Gas exchange in humans
- Course content
Scope: Course content · Subject-content route: any of Core, Extended (Core and Supplement) · §3, Topic 11, §11.1, Core outcomes 1–5.
Open revision guidance
What to know
- Human gas-exchange surfaces have a large area, a thin surface, a good blood supply and good ventilation with air; these features maintain rapid diffusion between alveolar air and blood. Locate the lungs, diaphragm, ribs, intercostal muscles, larynx, trachea, bronchi, bronchioles, alveoli and associated capillaries in the route from air entry to exchange.
- Inspired air contains more oxygen and less carbon dioxide than expired air; expired air contains more water vapour. Limewater tests carbon dioxide: bubble equal volumes of inspired and expired air through equal limewater samples under the same conditions and compare cloudiness, using fresh samples and a consistent flow/time. For an exercise investigation, use a safe, standardised activity, count breaths over the same interval at rest and after activity, repeat and record recovery; compare both rate and depth.
- Worked limewater method and result: a teacher provides equal 50 cm³ samples of room air and expired air in labelled gas syringes. Pass each through 10 cm³ fresh limewater at the same slow rate, using separate clean tubing and eye protection; never suck gas through limewater. In a model observation, room air leaves limewater clear or only faintly cloudy after 20 seconds, while expired air turns it milky sooner. This supports the greater carbon-dioxide content of expired air.
- Worked breathing dataset (simulated; one-minute count and single-user spirometer readings, no shared mouthpieces): rest = 14 breaths/min and 0.5 L tidal volume; immediately after one minute of gentle stepping = 25 breaths/min and 0.9 L; after three minutes' recovery = 17 breaths/min and 0.6 L. Rate and depth both rise with activity and move toward baseline during recovery. A teacher may instead provide these data; no learner needs to exercise. For practical work use a clean disposable mouthpiece, supervision and a stop rule for discomfort.
What to do in an assessment
- For a gas-composition comparison, state the direction for each gas (oxygen decreases, carbon dioxide and water vapour increase in expired air). In a limewater test, name the measured observation and keep sample volume, limewater volume and bubbling conditions comparable.
- For system diagrams, follow the air route and distinguish conducting tubes from alveoli; an unlabeled label line should point to the actual structure rather than nearby tissue.
In plain language
Ventilation refreshes alveolar air, and a thin, well-supplied surface allows oxygen and carbon dioxide to diffuse efficiently.
Self-check
Why should inspired and expired air be bubbled through equal volumes of limewater for equal periods?
Show the answer
Those controls make the comparison fair: a greater change in cloudiness can then be attributed to a difference in carbon dioxide content rather than unequal limewater amount or exposure time.
View diagrams
Human breathing systemSimplified schematic; not to scale. - A
- B
- C
- D
- E
- F
- G
- H
- I
- J
- K
Show labelled key: Answer key for breathing-system
Human breathing systemSimplified schematic; not to scale. - ALarynx
- BTrachea
- CBronchi
- DBronchioles
- EAlveoli
- FCapillaries
- GLung
- HRibs
- IIntercostal muscles
- JDiaphragm
- KNasal cavity
Intercostal muscles between two ribsSimplified schematic; not to scale. - A
- B
- C
- D
- E
- F
Show labelled key: Answer key for intercostal-muscles
Intercostal muscles between two ribsSimplified schematic; not to scale. - ARib above
- BRib below
- CExternal intercostal: fibres down and forwards
- DInternal intercostal: fibres down and backwards
- ESternum (front)
- FVertebra (back)
Identify airway, lungs, alveolus/capillary and diaphragm structures, then distinguish internal and external intercostal muscles in section. - Course content
Scope: Course content · Subject-content route: Extended (Core and Supplement) · §3, Topic 11, §11.1, Supplement outcomes 6–11.
Open revision guidance
What to know
- Cartilage supports the trachea and prevents its airway from collapsing. During inspiration, external intercostal muscles contract, ribs move up and out, and the diaphragm contracts and flattens; thoracic volume rises, pressure falls below atmospheric pressure and air enters. During quiet expiration, these muscles relax, ribs move down and in, diaphragm domes, volume falls, pressure rises and air leaves. Internal intercostal muscles can assist forced expiration.
- Physical activity increases muscle respiration and carbon dioxide concentration in blood. The brain detects the rise and coordinates faster, deeper breathing, increasing ventilation to remove carbon dioxide. Goblet cells make mucus that traps particles and pathogens; cilia on ciliated cells move the mucus toward the throat, where it can be swallowed or expelled, protecting lower airways.
What to do in an assessment
- For ventilation, state movement → thoracic volume change → pressure change → air direction. Avoid reversing the pressure relationship: air moves from higher external pressure to lower internal pressure.
- In a protection question, distinguish the jobs: goblet cells produce mucus, mucus traps particles/pathogens, cilia move it away from the lungs.
In plain language
Rib and diaphragm movements change thoracic pressure to ventilate the lungs; mucus and cilia help keep particles out.
Self-check
During inspiration, what happens to thoracic volume and pressure, and how does that make air enter?
Show the answer
Thoracic volume increases and pressure inside falls below atmospheric pressure. Air therefore moves into the lungs down the pressure gradient.
View diagrams
Human breathing systemSimplified schematic; not to scale. - A
- B
- C
- D
- E
- F
- G
- H
- I
- J
- K
Show labelled key: Answer key for breathing-system
Human breathing systemSimplified schematic; not to scale. - ALarynx
- BTrachea
- CBronchi
- DBronchioles
- EAlveoli
- FCapillaries
- GLung
- HRibs
- IIntercostal muscles
- JDiaphragm
- KNasal cavity
Intercostal muscles between two ribsSimplified schematic; not to scale. - A
- B
- C
- D
- E
- F
Show labelled key: Answer key for intercostal-muscles
Intercostal muscles between two ribsSimplified schematic; not to scale. - ARib above
- BRib below
- CExternal intercostal: fibres down and forwards
- DInternal intercostal: fibres down and backwards
- ESternum (front)
- FVertebra (back)
Identify airway, lungs, alveolus/capillary and diaphragm structures, then distinguish internal and external intercostal muscles in section.
Topic group
Respiration
- Course content
Scope: Course content · Subject-content route: any of Core, Extended (Core and Supplement) · §3, Topic 12, §§12.1–12.3, Core outcomes 1–2; 12.2 outcomes 1–2; 12.3 outcomes 1–4.
Open revision guidance
What to know
- Respiration is a chemical process in cells that releases energy for muscle contraction, protein synthesis, cell division, active transport, growth, nerve impulses and maintenance of a constant body temperature. Do not use 'respiration' as a synonym for breathing: breathing ventilates lungs; respiration is a cellular process.
- Aerobic respiration uses oxygen to break down nutrient molecules: glucose + oxygen → carbon dioxide + water. Anaerobic respiration breaks down nutrient molecules without oxygen and releases much less energy per glucose molecule. In yeast: glucose → alcohol + carbon dioxide; in muscles during vigorous exercise: glucose → lactic acid.
- To test temperature's effect on yeast respiration, mix equal yeast and glucose volumes, equilibrate replicate mixtures at different water-bath temperatures, keep pH, substrate concentration and total volume constant, and measure carbon dioxide produced in a fixed time (for example, gas-syringe volume). Use a control and repeats; compare mean rate, not unequal durations. Worked dataset (simulated means of three repeats; CO₂ volume in five minutes): 20°C = 5 cm³, 30°C = 13 cm³, 40°C = 8 cm³; a glucose-only no-yeast blank = 0 cm³. The example shows increased rate from 20°C to 30°C and a lower result at 40°C under these conditions; do not assume a universal optimum from three points. Use warm, not boiling, water, eye protection and a freely moving gas syringe; teacher demonstration or supplied data avoids unsafe handling.
What to do in an assessment
- In an equation question, select the correct pathway and organism/tissue before writing products. Include oxygen as a reactant only in the aerobic word equation.
- In a temperature experiment, identify temperature as the independent variable and CO₂ volume per unit time as the dependent variable; state controls, repeats and a safety step for warm water/glassware.
In plain language
Cells release energy by respiration; aerobic respiration uses oxygen, while anaerobic pathways release less energy and have different products.
Self-check
Write the Core word equation for anaerobic respiration in yeast, then state one difference from aerobic respiration.
Show the answer
Glucose → alcohol + carbon dioxide. It occurs without oxygen and releases much less energy per glucose molecule than aerobic respiration.
- Course content
Scope: Course content · Subject-content route: Extended (Core and Supplement) · §3, Topic 12, §12.2 Supplement outcome 3; §12.3 Supplement outcomes 5–7(a)–(c).
Open revision guidance
What to know
- Balance the aerobic equation by atom counts: C₆H₁₂O₆ + 6O₂ → 6CO₂ + 6H₂O. For yeast anaerobic respiration, C₆H₁₂O₆ → 2C₂H₅OH + 2CO₂. Check C, H and O on each side; do not change formula subscripts to balance an equation.
- During vigorous exercise, lactic acid builds up in muscles and blood, creating an oxygen debt. After exercise, heart rate stays high to transport lactic acid from muscles to liver; breathing stays faster and deeper to supply oxygen; lactic acid is aerobically respired in the liver. Link each prolonged response to debt removal rather than saying oxygen directly 'removes' lactic acid.
What to do in an assessment
- Balance each equation by making a short atom-count table for both sides, adjust whole-number coefficients only, then recount every element.
- For oxygen debt, use the order: lactic acid build-up → sustained circulation and ventilation → oxygen delivery to liver → aerobic respiration of lactic acid.
In plain language
Balanced equations conserve atoms, and continued breathing and circulation after exercise supply the oxygen needed to respire lactic acid.
Self-check
How does the body help remove oxygen debt after vigorous exercise?
Show the answer
Heart rate remains high to carry lactic acid in blood from muscles to the liver, while deeper and faster breathing supplies oxygen; the liver aerobically respires the lactic acid.
Topic group
Excretion in humans
- Course content
Scope: Course content · Subject-content route: any of Core, Extended (Core and Supplement) · §3, Topic 13, §13.1, Core outcomes 1–3.
Open revision guidance
What to know
- Excretion removes metabolic waste. Carbon dioxide leaves through the lungs. Kidneys excrete urea plus excess water and ions in urine. Identify the urinary route on a body diagram: paired kidneys produce urine, ureters carry it to the bladder for storage, and the urethra carries it out of the body. Ureters and urethra are not interchangeable.
- Urea is a metabolic waste, not simply undigested protein; its liver formation from excess amino acids belongs to Supplement. For a labelled-system question, follow each tube from its organ of origin and state direction of movement.
What to do in an assessment
- Separate excretion from egestion: match a waste product to the organ that removes it. On a urinary-system diagram, locate organs first, then trace urine from kidney → ureter → bladder → urethra.
In plain language
The lungs remove carbon dioxide, and kidneys remove urea and excess water/ions in urine.
Self-check
A label points to the tube carrying urine from a kidney to the bladder. What is it, and which route does urine then follow?
Show the answer
It is a ureter. Urine passes to the bladder, where it is stored, and leaves through the urethra.
View diagrams
Human urinary systemSimplified schematic; not to scale. Blood flow: heart → aorta → renal arteries → kidneys → renal veins → vena cava → heart. - A
- B
- C
- D
- E
- F
- G
- H
- I
Show labelled key: Answer key for urinary-system
Human urinary systemSimplified schematic; not to scale. Blood flow: heart → aorta → renal arteries → kidneys → renal veins → vena cava → heart. - AKidney
- BUreter
- CUrinary bladder
- DUrethra
- EKidney
- FAorta
- GVena cava
- HRenal arteries
- IRenal veins
Section through a kidneySimplified schematic; not to scale. - A
- B
- C
- D
- E
- F
Show labelled key: Answer key for kidney-section
Section through a kidneySimplified schematic; not to scale. - ARenal cortex
- BRenal medulla
- CRenal pelvis
- DUreter
- ERenal artery
- FRenal vein
Trace urine-flow structures on the urinary-system diagram and identify cortex/medulla on the keyed kidney section. - Course content
Scope: Course content · Subject-content route: Extended (Core and Supplement) · §3, Topic 13, §13.1, Supplement outcomes 4–9, including outcome 5(a)–(c).
Open revision guidance
What to know
- The kidney has an outer cortex and inner medulla. A nephron and its associated blood vessels filter and selectively reabsorb. At the glomerulus, water, glucose, urea and ions are filtered from blood. The nephron returns all glucose, some ions and most water to blood. Urine therefore contains urea, excess water and excess ions; the syllabus does not require microscopic process details.
- The liver assimilates amino acids by converting them into proteins. When amino acids are in excess, the liver removes their nitrogen-containing part (deamination) and forms urea. Urea is toxic if it accumulates, so excretion is important. Keep the sequence distinct: amino acids → deamination in liver → urea → transport in blood → kidney excretion.
What to do in an assessment
- In a nephron flow question, distinguish what is filtered from what is reabsorbed and what remains in urine. Use the exact quantities: all glucose, some ions, most water return to blood; urea and excess water/ions remain in urine.
- For amino-acid metabolism, connect protein assimilation with excess-amino-acid deamination, then explain why toxic urea must be removed. No extra biochemical detail is needed.
In plain language
The nephron filters blood and returns useful materials; the liver converts excess amino-acid nitrogen to toxic urea, which the kidneys excrete.
Self-check
Glucose is filtered at the glomerulus. Why should it normally not be present in urine, and what substances are expected to remain?
Show the answer
All filtered glucose is reabsorbed back into the blood by the nephron. Urine contains urea, excess water and excess ions.
View diagrams
Human urinary systemSimplified schematic; not to scale. Blood flow: heart → aorta → renal arteries → kidneys → renal veins → vena cava → heart. - A
- B
- C
- D
- E
- F
- G
- H
- I
Show labelled key: Answer key for urinary-system
Human urinary systemSimplified schematic; not to scale. Blood flow: heart → aorta → renal arteries → kidneys → renal veins → vena cava → heart. - AKidney
- BUreter
- CUrinary bladder
- DUrethra
- EKidney
- FAorta
- GVena cava
- HRenal arteries
- IRenal veins
Section through a kidneySimplified schematic; not to scale. - A
- B
- C
- D
- E
- F
Show labelled key: Answer key for kidney-section
Section through a kidneySimplified schematic; not to scale. - ARenal cortex
- BRenal medulla
- CRenal pelvis
- DUreter
- ERenal artery
- FRenal vein
Trace urine-flow structures on the urinary-system diagram and identify cortex/medulla on the keyed kidney section.
Topic group
Coordination and response
- Course content
Scope: Course content · Subject-content route: any of Core, Extended (Core and Supplement) · §3, Topic 14, §§14.1–14.5, Core outcomes 14.1 1–7 (including 2(a)–(b)); 14.2 1–4 (including 3(a)–(e)); 14.3 1–4 (including 2(a)–(d), 3(a)–(c)); 14.4 1–2; 14.5 1–3.
Open revision guidance
What to know
- Electrical impulses travel along neurones. The CNS is the brain and spinal cord; the PNS is nerves outside them. The nervous system coordinates and regulates body functions. A simple reflex route is stimulus → receptor → sensory neurone → relay neurone in CNS → motor neurone → effector (muscle or gland). A reflex is rapid and automatic, integrating a stimulus with an effector response. A synapse is the junction between two neurones.
- Sense organs contain receptor-cell groups responsive to specific stimuli: light, sound, touch, temperature and chemicals. The eye's cornea refracts light; iris controls light entering through the pupil; lens focuses light on retina; retina contains light receptors, some sensitive to different colours; optic nerve carries impulses to brain. Blind spot is where the optic nerve leaves the eye. Bright light reduces pupil diameter; dim light increases it.
- A hormone is a chemical made by a gland, carried in blood, that changes activity of one or more specific target organs. Adrenal glands secrete adrenaline, pancreas insulin, testes testosterone and ovaries oestrogen. Adrenaline is secreted in fight-or-flight situations and increases breathing rate, heart rate and pupil diameter. Nervous control is faster and typically shorter-lived than hormonal control.
- Homeostasis maintains a constant internal environment. Insulin decreases blood glucose concentration. In plants, gravitropism is growth toward/away from gravity and phototropism is growth toward/away from the direction of light. To investigate shoot/root responses, place germinating seedlings in controlled orientations and light directions, include an upright/directional control, keep water and temperature constant, and record growth direction over time. Worked tropism investigation: place comparable germinating seedlings horizontally in moist covered trays in darkness to test gravity, and place upright seedlings in boxes with one side aperture to test directional light; use upright and diffuse-light controls, equal seed age, moisture, temperature and time. After 24 hours, illustrative means for five seedlings are: horizontal/dark shoots curve 60° upward and roots 50° downward; side-lit shoots curve 35° toward light and roots 20° away; controls remain nearly straight. Record angle/direction from a fixed starting axis. Use clean seeds and trays, wash hands and discard growth safely; teacher-supplied images/data are suitable.
What to do in an assessment
- For reflex-arc questions, order the five components and make clear that the receptor detects the stimulus and the effector produces the response. For nervous/hormonal comparisons, name speed and duration rather than claiming one system has no effect.
- For tropism practical questions, state orientation/light as the changed condition, growth direction or angle as the response, and constant water, temperature and time. Use the specific stimulus in the conclusion.
In plain language
Nerves and hormones coordinate body responses; homeostasis keeps internal conditions stable, and plants direct growth in response to gravity and light.
Self-check
A person touches a hot surface and rapidly withdraws a hand. Put the reflex pathway in order and identify the effector.
Show the answer
Receptor → sensory neurone → relay neurone in the CNS → motor neurone → effector. The hand muscle is the effector that contracts to withdraw the hand.
View diagrams
Sensory, relay and motor neuronesSimplified schematic; not to scale. - A
- B
- C
- D
- E
- F
Show labelled key: Answer key for neurone-types
Sensory, relay and motor neuronesSimplified schematic; not to scale. - ASensory neurone
- BCell body
- CRelay neurone
- DMotor neurone
- EDendrites
- FAxon
Section through the human eyeSimplified schematic; not to scale. - A
- B
- C
- D
- E
- F
- G
- H
- I
- J
Show labelled key: Answer key for eye-section
Section through the human eyeSimplified schematic; not to scale. - ACornea
- BIris
- CPupil
- DLens
- ERetina
- FOptic nerve
- GBlind spot
- HFovea
- ISclera
- JChoroid
Selected endocrine glandsOvaries and testes are shown in separate anatomical examples. Simplified schematic; not to scale. - A
- B
- C
- D
Show labelled key: Answer key for endocrine-glands
Selected endocrine glandsOvaries and testes are shown in separate anatomical examples. Simplified schematic; not to scale. - AAdrenal glands
- BPancreas
- CTestes
- DOvaries
Section through human skinSimplified schematic; not to scale. - A
- B
- C
- D
- E
- F
- G
- H
- I
Show labelled key: Answer key for skin-section
Section through human skinSimplified schematic; not to scale. - AHair
- BErector muscle
- CSweat gland
- DReceptor
- ESensory neurone
- FBlood vessels
- GFatty tissue
- HSweat duct
- ISweat pore
Practise distinguishing neurone types, eye anatomy, endocrine-gland locations and skin thermoregulation structures with keyed views. - Course content
Scope: Course content · Subject-content route: Extended (Core and Supplement) · §3, Topic 14, §§14.1–14.5, Supplement outcomes 14.1 8–10 (including 9(a)–(d)); 14.2 5–9 (including 8(a)–(b)); 14.3 5–6(a)–(b); 14.4 3–8; 14.5 4–5(a)–(d).
Open revision guidance
What to know
- A synapse contains vesicles of neurotransmitter in one neurone, a synaptic gap and receptor proteins on the next. An arriving impulse triggers neurotransmitter release; molecules diffuse across the gap and bind complementary receptors, stimulating an impulse in the next neurone. Because release occurs from vesicles on one side and receptors are on the next, transmission is one-way.
- Pupil reflex uses antagonistic circular and radial iris muscles: in bright light circular muscles contract and radial relax, constricting the pupil; in dim light radial muscles contract and circular relax, dilating it. For accommodation, near objects require ciliary muscles to contract, suspensory ligaments to slacken and the lens to become thicker/more convex, increasing refraction; distant focus uses relaxed ciliary muscles, taut ligaments and a thinner lens with less refraction. Rods are concentrated toward the peripheral retina and absent from the fovea; cones are most concentrated at the fovea. Rods are more sensitive for night vision, while three cone types absorb different colours for colour vision. The fovea is the central retinal region with greatest visual acuity.
- Glucagon is secreted by the pancreas. In blood-glucose control, insulin promotes uptake/storage of glucose and lowers blood glucose; glucagon prompts the liver to release glucose, raising it. Negative feedback reverses deviation from a set point: a rise elicits a response that lowers the variable, and a fall elicits a response that raises it. Type 1 diabetes treatment includes insulin, with dose, food and activity managed to control blood glucose. Skin temperature responses include hairs and erector muscles, sweat glands, receptors, sensory neurones, blood vessels and fatty tissue; sweating cools by evaporation, shivering produces heat, insulation limits heat loss, and the brain coordinates responses. Vasodilation increases blood flow through surface capillaries for heat loss; vasoconstriction reduces it.
- Shoots show positive phototropism and negative gravitropism; roots commonly show positive gravitropism. These are chemical growth responses. Auxin is made in the shoot tip and diffuses through the plant; light and gravity cause unequal auxin distribution. In a shoot, higher auxin on the shaded/lower side stimulates greater cell elongation there, bending the shoot toward light or upward against gravity.
What to do in an assessment
- For synapse sequencing, use release → diffusion → receptor binding → next impulse, then explain one-way flow from the locations of vesicles and receptors.
- For eye questions, state both muscle/ligament changes and lens shape before explaining refraction. For homeostasis, name the set point, direction of change and a response that reverses it; for temperature, distinguish heat production, insulation and heat transfer at skin.
- For a tropism explanation, identify stimulus and auxin distribution first, then compare cell elongation on opposite sides and infer the bend direction. Do not say auxin makes all shoot cells elongate equally.
In plain language
Signals cross synapses in one direction, eyes adjust focus and light entry, hormones and skin responses maintain internal conditions, and auxin steers plant growth.
Self-check
In bright light, which iris muscle contracts, what happens to pupil diameter, and why does a shoot bend toward a one-sided light source?
Show the answer
Circular iris muscles contract, decreasing pupil diameter. Auxin becomes more concentrated on the shaded side of the shoot, where it stimulates more cell elongation; that side grows longer and the shoot bends toward the light.
View diagrams
Sensory, relay and motor neuronesSimplified schematic; not to scale. - A
- B
- C
- D
- E
- F
Show labelled key: Answer key for neurone-types
Sensory, relay and motor neuronesSimplified schematic; not to scale. - ASensory neurone
- BCell body
- CRelay neurone
- DMotor neurone
- EDendrites
- FAxon
Section through the human eyeSimplified schematic; not to scale. - A
- B
- C
- D
- E
- F
- G
- H
- I
- J
Show labelled key: Answer key for eye-section
Section through the human eyeSimplified schematic; not to scale. - ACornea
- BIris
- CPupil
- DLens
- ERetina
- FOptic nerve
- GBlind spot
- HFovea
- ISclera
- JChoroid
Selected endocrine glandsOvaries and testes are shown in separate anatomical examples. Simplified schematic; not to scale. - A
- B
- C
- D
Show labelled key: Answer key for endocrine-glands
Selected endocrine glandsOvaries and testes are shown in separate anatomical examples. Simplified schematic; not to scale. - AAdrenal glands
- BPancreas
- CTestes
- DOvaries
Section through human skinSimplified schematic; not to scale. - A
- B
- C
- D
- E
- F
- G
- H
- I
Show labelled key: Answer key for skin-section
Section through human skinSimplified schematic; not to scale. - AHair
- BErector muscle
- CSweat gland
- DReceptor
- ESensory neurone
- FBlood vessels
- GFatty tissue
- HSweat duct
- ISweat pore
Practise distinguishing neurone types, eye anatomy, endocrine-gland locations and skin thermoregulation structures with keyed views.
Topic group
Topic 15 Core
- Course content
Scope: Course content · Subject-content route: any of Core, Extended (Core and Supplement) · Practical examination: any of Paper 5: Practical Test, Paper 6: Alternative to Practical · §3 Topic 15 Drugs: §15.1 Core 1; §15.1 Core 2; §15.1 Core 3; §15.1 Core 4
Open revision guidance
What to know
- A drug is any substance taken into the body that modifies or affects chemical reactions. Antibiotics are used to treat bacterial infections: they kill bacteria or prevent their growth, but they do not affect viruses, whose replication takes place inside host cells. Antibiotics therefore do not treat a cold caused by a virus.
- Some bacteria already carry variation that makes them resistant. If an antibiotic is used, susceptible bacteria die while resistant bacteria survive, reproduce and pass resistance on; the resistant fraction can grow, making the antibiotic less effective. Antibiotic resistance is selection of bacteria, not an individual bacterium choosing to adapt.
What to do in an assessment
- For a treatment question, identify whether the pathogen is bacterial or viral before choosing an antibiotic. For a resistance explanation, link pre-existing variation → differential survival during treatment → reproduction/inheritance → increased frequency of resistance.
In plain language
Antibiotics work against bacteria, not viruses; overuse gives resistant bacteria a survival advantage.
Self-check
A student takes antibiotics for influenza and stops a later course as soon as symptoms improve. Explain two problems.
Show the answer
Influenza is caused by a virus, so an antibiotic will not treat it. Stopping early may leave bacteria that were less susceptible alive; they can reproduce and pass on resistance, increasing the chance that a resistant population develops.
Topic group
Topic 15 Supplement
- Course content
Scope: Course content · Subject-content route: Extended (Core and Supplement) · Practical examination: any of Paper 5: Practical Test, Paper 6: Alternative to Practical · §3 Topic 15 Drugs: §15.1 Supplement 5
Open revision guidance
What to know
- Use antibiotics only when essential and as directed. Avoiding unnecessary courses reduces the number of occasions on which susceptible bacteria are removed and resistant variants are favoured. This slows selection for resistant strains such as MRSA; it does not guarantee that resistance will never arise.
- In an exam, distinguish the cause of resistance (random genetic variation/mutation) from the selective agent (antibiotic exposure). The medicine does not make a bacterium deliberately change; survivors reproduce and transmit resistance.
What to do in an assessment
- Write the causal chain explicitly: unnecessary exposure → susceptible bacteria die → resistant bacteria survive → resistant bacteria reproduce and pass resistance alleles → proportion resistant rises. State that responsible use limits selection rather than instantly removing existing resistance.
In plain language
Using antibiotics only when necessary reduces the selective advantage given to resistant bacteria.
Self-check
In a bacterial population, 2 of 100 bacteria are resistant before treatment. Why can unnecessary antibiotic use increase the proportion resistant?
Show the answer
The antibiotic kills susceptible bacteria more readily; the 2 resistant bacteria are more likely to survive, reproduce and pass resistance on. If unnecessary courses repeatedly impose this selection, resistant descendants make up a larger proportion, even if the antibiotic did not cause those bacteria to choose resistance.
Topic group
Topic 16 Core
- Course content
Scope: Course content · Subject-content route: any of Core, Extended (Core and Supplement) · Practical examination: any of Paper 5: Practical Test, Paper 6: Alternative to Practical · §3 Topic 16 Reproduction: §16.1 Core 1; §16.1 Core 2; §16.2 Core 1; §16.2 Core 2; §16.3 Core 1; §16.3 Core 2; §16.3 Core 3; §16.3 Core 4; §16.3 Core 5; §16.3 Core 6; §16.3 Core 7; §16.3 Core 8; §16.4 Core 1; §16.4 Core 2; §16.4 Core 3; §16.4 Core 4; §16.4 Core 5; §16.4 Core 6; §16.4 Core 7; §16.4 Core 8; §16.5 Core 1; §16.5 Core 2; §16.6 Core 1; §16.6 Core 2; §16.6 Core 3; §16.6 Core 4; §16.6 Core 5
Open revision guidance
What to know
- Asexual reproduction uses one parent and produces genetically identical offspring (clones); examples include strawberry runners, potato tubers and binary fission in bacteria. Recognise asexual examples in a description or image by one-parent reproduction without fusion of gamete nuclei; it is fast and can preserve a successful genotype, but a uniform population has little variation if conditions change. For crops it can reliably multiply desired plants quickly, but disease or environmental change may affect many clones. Sexual reproduction fuses nuclei of two gametes at fertilisation to form a zygote; offspring are genetically different. Its variation can improve a wild population’s response to change, but finding mates and producing gametes costs time/resources; uniform crop traits may be harder to maintain. Gamete nuclei are haploid; the zygote nucleus is diploid.
- Flower structure and function: sepals protect the bud; petals often attract pollinators; a stamen consists of filament supporting anther, which makes pollen; a carpel includes stigma (receives pollen), style (route toward ovary), ovary (contains ovules), and ovules (contain female nuclei). Wind-pollinated flowers typically have exposed dangling anthers, large feathery exposed stigmas and numerous small/light pollen; insect-pollinated flowers commonly have anthers inside, sticky stigmas and larger/spiky or sticky pollen. Pollination is anther-to-stigma transfer. Fertilisation occurs when the pollen nucleus fuses with a nucleus in an ovule. Insect-pollinated flowers commonly have conspicuous petals, scent/nectar and pollen that adheres to animals; wind-pollinated flowers expose anthers/stigmas and release abundant light pollen. These are contrasting patterns, not universal rules for every species.
- Seed germination requires water, oxygen and a suitable temperature. To investigate one condition, place equal numbers of similar seeds on identical moist supports; vary only the chosen factor (for example, water present/absent), keep seed type, number, temperature and observation period controlled, use replicates, and record the number germinating at regular times. To test oxygen, compare aerated moist support with a waterlogged/oxygen-limited treatment; to test temperature, use otherwise identical sets at measured temperatures. Do not change water, oxygen and temperature together.
- Human reproduction: testes produce sperm; scrotum holds testes outside the body; sperm ducts carry sperm; prostate adds fluid; urethra carries urine or semen out (not simultaneously); penis transfers semen. Ovaries produce egg cells and sex hormones; oviducts carry eggs and are usual fertilisation sites; uterus supports embryo/fetus development; cervix is the narrow opening to the uterus; vagina receives penis/semen and is the birth canal. Sperm’s flagellum enables movement, mitochondria release energy for movement and acrosome enzymes help penetrate egg coverings. An egg is larger, non-motile, has energy stores and a jelly coat that changes at fertilisation to reduce entry of additional sperm. Sperm are small and produced in large numbers; eggs are large and released in much smaller numbers. Fertilisation fuses sperm and egg nuclei; the zygote divides to form an embryo, a ball of cells that implants in the uterine lining. The umbilical cord connects fetus and placenta; placenta enables dissolved nutrients, gases and excretory products to exchange between maternal and fetal blood without their blood mixing; amniotic sac/fluid surround and cushion the fetus.
- During puberty, testosterone and oestrogen promote development and regulation of secondary sexual characteristics. In the menstrual cycle, FSH stimulates an ovarian follicle/egg to mature and oestrogen production; oestrogen rebuilds the uterine lining. A high oestrogen level triggers an LH surge, which causes ovulation. The emptied follicle forms a corpus luteum that secretes progesterone; progesterone maintains the uterine lining and suppresses FSH/LH so another egg does not mature immediately. If pregnancy does not occur, progesterone and oestrogen fall and the lining is shed. In pregnancy, progesterone (initially corpus luteum, later placenta) and oestrogen from the placenta help maintain the lining. An STI is transmitted through sexual contact. HIV is a pathogen that causes an STI and may lead to AIDS; it can pass in infected blood/sexual fluids and from mother to child. It is not transmitted by ordinary social contact. STI spread can be reduced by condoms, testing and prompt treatment, informing partners, and avoiding sexual contact while infectious.
- Worked source-style identification schematics (text-only, not to scale): for an insect-pollinated flower trace the central carpel as stigma → style → ovary (containing ovules); each stamen is an anther (pollen) supported by a filament; petals surround the reproductive parts and sepals sit at the base. In a wind-pollinated specimen, identify exposed dangling anthers and a large feathery stigma; compare its small/light pollen with the larger/stickier or spiky pollen associated with insect transport. Drawing method: outline the overall flower proportion, place ovary at the base of the carpel, connect style to stigma, add anthers on filaments, then petals and sepals; use fine unshaded outlines and label lines. Use the attached flower-structure and pollination-comparison practice views and closed keys alongside the source-required drawing conventions.
- Worked human-system schematic cues (text-only, not to scale): male sperm route = testes (inside scrotum) → sperm ducts → prostate adds fluid → urethra → penis; female egg route = ovaries → oviducts → uterus → cervix → vagina. Fetus/placenta diagram cue = fetus — umbilical cord — placenta; fetus lies inside amniotic sac, with amniotic fluid around it. A label at the narrow passage between uterus and vagina is the cervix; a label on the tube from ovary toward uterus is the oviduct. Placenta exchanges dissolved nutrients, gases and excretory products while maternal and fetal blood remain separate. Use the attached male/female reproductive-system and fetal-support practice views, then check the keyed anatomical relationships.
What to do in an assessment
- For comparisons, organise by parent number, genetic similarity, gamete fusion and offspring variation; then weigh the consequences for wild populations versus uniform crop production. For plant structure questions, link each named part to its function. In a germination experiment, state the independent variable, measured germination, controlled conditions, repeats and how results are recorded. For hormone-cycle questions, use FSH → follicle/oestrogen → LH surge/ovulation → corpus luteum/progesterone → maintained lining; explain the hormone fall and menstruation if no pregnancy. For STI control, pair a transmission route with a prevention measure.
In plain language
Reproduction can clone one successful parent or combine gametes to create variation; plant and human structures support fertilisation and development.
Self-check
In a germination test, 20 seeds are placed on moist cotton at 20 °C, while 20 seeds are placed on dry cotton at 20 °C. What is changed, what must be kept constant, and what result should be counted?
Show the answer
Water availability is the independent variable. Keep seed species/age, number, temperature, light and observation period the same; use replicates if possible. Count the number of seeds that germinate in each group at the same time intervals, rather than judging growth from unequal samples.
View diagrams
Asexual reproduction: potato tuber. A new potato plant grows from a bud on a parent tuber. One parent is shown; no gamete fusion is depicted. Simplified schematic, not to scale. Use genuine photomicrographs separately where specimen recognition is required.
Show labelled key: Answer key for asexual-example
Asexual reproduction: potato tuber. A new potato plant grows from a bud on a parent tuber. One parent is shown; no gamete fusion is depicted. - Parent potato tuber / Cloron tatws rhiant
- Bud (eye) / blaguryn (llygad)
- New shoot / eginyn newydd
- New tuber / cloron newydd
Simplified schematic, not to scale. Use genuine photomicrographs separately where specimen recognition is required.
Flower structure. Simplified flower showing the stamen and carpel structures, petals and sepals. Simplified schematic, not to scale. Use genuine photomicrographs separately where specimen recognition is required.
Show labelled key: Answer key for flower-structure
Flower structure. Simplified flower showing the stamen and carpel structures, petals and sepals. - Anther / Blwrïan
- Filament / Ffilament
- Stigma / Stigma
- Style / Arddull
- Ovary / Ofari
- Ovule / Ofwl
- Petal / Petal
- Sepal / Sepal
Simplified schematic, not to scale. Use genuine photomicrographs separately where specimen recognition is required.
Typical pollination adaptations. A comparison of typical wind-pollinated and insect-pollinated flower features and pollen. Patterns vary among species. Simplified schematic, not to scale. Use genuine photomicrographs separately where specimen recognition is required.
Show labelled key: Answer key for pollination-comparison
Typical pollination adaptations. A comparison of typical wind-pollinated and insect-pollinated flower features and pollen. Patterns vary among species. - Exposed, dangling anthers / Blwrïau agored, yn hongian
- Feathery exposed stigma / Stigma pluog agored
- Small, light pollen grains / Grawn paill bach, ysgafn
- Anthers within the flower / Blwrïau o fewn y blodyn
- Sticky stigma / Stigma gludiog
- Larger, sticky or spiky pollen / Paill mwy, gludiog neu bigog
Simplified schematic, not to scale. Use genuine photomicrographs separately where specimen recognition is required.
Male reproductive system. Simplified schematic showing testes held in the scrotum, sperm ducts, prostate, urethra and penis. Anatomical orientation is front-facing. Simplified schematic, not to scale. Use genuine photomicrographs separately where specimen recognition is required.
Show labelled key: Answer key for male-reproduction
Male reproductive system. Simplified schematic showing testes held in the scrotum, sperm ducts, prostate, urethra and penis. Anatomical orientation is front-facing. - Sperm duct / Sberm-ddwythell
- Prostate gland / Chwarren brostad
- Urethra / Wrethra
- Penis / Pidyn
- Testis / Ceilliau
- Scrotum / Ceillgwd
Simplified schematic, not to scale. Use genuine photomicrographs separately where specimen recognition is required.
Female reproductive system. Simplified front-facing schematic showing ovaries, oviducts, uterus, cervix and vagina. Simplified schematic, not to scale. Use genuine photomicrographs separately where specimen recognition is required.
Show labelled key: Answer key for female-reproduction
Female reproductive system. Simplified front-facing schematic showing ovaries, oviducts, uterus, cervix and vagina. - Ovary / Ofari
- Oviduct / Dwythell wy
- Uterus / Croth
- Cervix / Ceg y groth
- Vagina / Fagina
Simplified schematic, not to scale. Use genuine photomicrographs separately where specimen recognition is required.
Fetus and supporting structures. Simplified schematic showing fetus, placenta, umbilical cord, amniotic sac and amniotic fluid. Maternal and fetal blood remain separate; this diagram does not show blood mixing. Simplified schematic, not to scale. Use genuine photomicrographs separately where specimen recognition is required.
Show labelled key: Answer key for fetal-support
Fetus and supporting structures. Simplified schematic showing fetus, placenta, umbilical cord, amniotic sac and amniotic fluid. Maternal and fetal blood remain separate; this diagram does not show blood mixing. - Placenta / Brych
- Umbilical cord / Llinyn bogail
- Amniotic sac / Sach amniotig
- Amniotic fluid / Hylif amniotig
- Fetus / Ffetws
Simplified schematic, not to scale. Use genuine photomicrographs separately where specimen recognition is required.
Practise source-listed reproductive structures, flower/pollen comparisons, pollination, human reproductive systems and fetal-support structures with matching keys.
Topic group
Topic 16 Supplement
- Course content
Scope: Course content · Subject-content route: Extended (Core and Supplement) · Practical examination: any of Paper 5: Practical Test, Paper 6: Alternative to Practical · §3 Topic 16 Reproduction: §16.1 Supplement 3; §16.2 Supplement 3; §16.2 Supplement 4; §16.3 Supplement 9; §16.3 Supplement 10; §16.3 Supplement 11; §16.3 Supplement 12; §16.4 Supplement 9; §16.4 Supplement 10; §16.5 Supplement 3; §16.5 Supplement 4
Open revision guidance
What to know
- Pollination routes: self-pollination transfers pollen from a flower’s anther to the stigma of the same flower or another flower on that plant; cross-pollination transfers it to a flower on another plant of the same species. Selfing can preserve successful combinations and reduce reliance on pollinators, but tends to produce less genetic variation and can reduce a population’s ability to respond to change. Cross-pollination generally increases variation and potential resilience, but may depend more on pollinators and brings pollen from another plant. After compatible pollen lands on a stigma it germinates; a pollen tube grows down the style and enters an ovule, carrying a nucleus that fuses with the ovule nucleus. Endosperm/developmental details are not needed.
- The placenta and umbilical cord support exchange of dissolved nutrients, gases and excretory products between maternal and fetal blood; maternal and fetal blood remain separate. Some pathogens and toxins can cross the placenta and harm the fetus.
- In the menstrual cycle, FSH supports follicle development and oestrogen production; oestrogen rebuilds the uterine lining and at a high level triggers LH release. LH causes ovulation. Progesterone, produced by the corpus luteum after ovulation, maintains the lining and inhibits FSH/LH. If there is no pregnancy, progesterone falls and menstruation follows; in pregnancy, the placenta produces oestrogen and progesterone to maintain conditions for the embryo/fetus. During early pregnancy the corpus luteum supplies progesterone before placental production takes over.
What to do in an assessment
- When comparing self- and cross-pollination, separate genetic variation, resilience to environmental change and dependence on pollinators. In a fertilisation sequence, place pollen transfer first, then pollen tube growth to the ovule, then fusion of nuclei. For hormones, explain what changes in the ovary and uterus and connect each change to FSH, LH, oestrogen or progesterone.
In plain language
Pollen tubes deliver a male nucleus to an ovule; cycle hormones coordinate ovulation and maintain the uterine lining.
Self-check
A plant’s pollen reaches a stigma on another plant of the same species. Name the pollination type and describe what must happen next for fertilisation.
Show the answer
It is cross-pollination. The pollen grain germinates on the stigma, a pollen tube grows down to and enters an ovule, and the pollen nucleus fuses with a nucleus in that ovule.
Topic group
Topic 17 Core
- Course content
Scope: Course content · Subject-content route: any of Core, Extended (Core and Supplement) · Practical examination: any of Paper 5: Practical Test, Paper 6: Alternative to Practical · §3 Topic 17 Inheritance: §17.1 Core 1; §17.1 Core 2; §17.1 Core 3; §17.1 Core 4; §17.4 Core 1; §17.4 Core 2; §17.4 Core 3; §17.4 Core 4; §17.4 Core 5; §17.4 Core 6; §17.4 Core 7; §17.4 Core 8; §17.4 Core 9; §17.4 Core 10; §17.4 Core 11; §17.4 Core 12
Open revision guidance
What to know
- Chromosomes are made of DNA, which carries genetic information in genes; a gene is a length of DNA that codes for a protein, and an allele is an alternative form of a gene. In humans, females are usually XX and males XY: an egg contributes X, while sperm contribute X or Y, so the sperm chromosome determines the child’s chromosomal sex. A genetic cross predicts possibilities, not a guaranteed outcome for each family.
- Inheritance is transmission of genetic information between generations. Genotype is an organism’s allele combination; phenotype is its observable characteristic. Homozygous means two identical alleles and true-breeding homozygotes crossed together breed true; heterozygous means two different alleles and is not pure-breeding. A dominant allele is expressed when present; a recessive phenotype appears only when no dominant allele is present.
- Worked Punnett method (use B for dominant brown seeds, b for recessive green): write the parents’ genotypes, list each parent’s gametes, place one parent’s gametes along the top and the other’s down the side, combine one allele from each in each cell, then count genotypes and phenotypes. For Bb × Bb: gametes B,b and B,b produce BB, Bb, Bb, bb. Genotype ratio is 1 BB : 2 Bb : 1 bb; phenotype ratio is 3 brown : 1 green. For Bb × bb, offspring are Bb, Bb, bb, bb, so the phenotype ratio is 1 dominant : 1 recessive. A ratio is an expected probability across many offspring, not an exact promise for a small family.
- Worked monohybrid diagram (rows are one parent’s gametes; columns are the other’s): cross Bb × Bb; gametes B,b and B,b. Grid: top headings B | b; row B gives BB | Bb; row b gives Bb | bb. Count 1 BB : 2 Bb : 1 bb and, if B is dominant, 3 dominant : 1 recessive. A separate worked pedigree schematic: Generation I unaffected father □—○ unaffected mother; their Generation II children are ○ unaffected and ● affected (□ male, ○ female, filled = affected). If the named condition is recessive, the affected daughter is aa; each unaffected parent must have supplied a, so both are carriers Aa. Use the worked symbol key as a text-based pedigree exercise; when a pedigree stimulus is supplied, trace the stated characteristic through each generation and justify genotype inferences from relatives.
What to do in an assessment
- Show parent genotypes → gametes → completed allele combinations → genotype ratio → phenotype ratio. Keep genotype symbols consistent and state which allele is dominant. In pedigree tasks, trace the specified characteristic generation by generation and support an inference with affected/unaffected relatives; the text-symbol case provides a worked inference pattern; apply it to the specific pedigree and inheritance information supplied in a question.
In plain language
Genes are DNA sections; alleles are alternatives. A cross works by combining one allele from each parent in every possible gamete pairing.
Self-check
Pedigree schematic: Generation I unaffected father □—○ unaffected mother; their Generation II children are ○ unaffected and ● affected (□ male, ○ female, filled = affected). If the characteristic is recessive, what genotype must the affected child have, and what must be true of the unaffected parents?
Show the answer
The affected child must be aa. Each unaffected parent must have supplied a recessive a allele, so both parents are heterozygous carriers Aa. The unaffected sibling could be AA or Aa; the diagram alone does not distinguish those genotypes.
Topic group
Topic 17 Supplement
- Course content
Scope: Course content · Subject-content route: Extended (Core and Supplement) · Practical examination: any of Paper 5: Practical Test, Paper 6: Alternative to Practical · §3 Topic 17 Inheritance: §17.1 Supplement 5; §17.1 Supplement 6; §17.1 Supplement 7; §17.1 Supplement 8; §17.1 Supplement 9; §17.1 Supplement 10; §17.1 Supplement 11; §17.1 Supplement 12; §17.2 Supplement 1; §17.2 Supplement 2; §17.2 Supplement 3; §17.2 Supplement 4; §17.2 Supplement 5; §17.3 Supplement 1; §17.3 Supplement 2; §17.4 Supplement 13; §17.4 Supplement 14; §17.4 Supplement 15; §17.4 Supplement 16; §17.4 Supplement 17; §17.4 Supplement 18
Open revision guidance
What to know
- A gene’s base sequence determines the amino-acid sequence in a protein; different amino-acid sequences fold into different shapes, which enables different functions. DNA controls cell function by directing proteins such as enzymes, membrane carriers and neurotransmitter receptors. The gene remains in the nucleus; an mRNA copy is made there and moves into the cytoplasm, passes through a ribosome, and the ribosome assembles amino acids in the order specified by the mRNA bases. Transcription/translation detail and nucleotide structure are not required. Most body cells contain the same genes, but cells express different subsets and make the proteins needed for their specialised roles.
- A haploid nucleus has one set of chromosomes; a diploid nucleus has two sets, with a pair of each type. Human diploid cells have 23 pairs. Mitosis is nuclear division producing genetically identical cells: chromosomes replicate exactly before division, copies separate so chromosome number is maintained, enabling growth, tissue repair, replacement and asexual reproduction. Stem cells are unspecialised and divide by mitosis; their daughter cells can specialise. Meiosis makes gametes and halves chromosome number from diploid to haploid, producing genetically different cells; no stage-by-stage account is required.
- An unknown dominant-phenotype genotype is tested by crossing it with a homozygous recessive (aa). If the unknown is AA, all offspring receive A and show the dominant phenotype; if it is Aa, the cross Aa × aa gives half Aa (dominant) and half aa (recessive). In codominance both alleles contribute visibly in a heterozygote. ABO alleles are Iᴬ, Iᴮ and Iᴼ; Iᴬ and Iᴮ are codominant and each dominates Iᴼ. Thus IᴬIᴮ is blood group AB, IᴬIᴼ is A, IᴮIᴼ is B, and IᴼIᴼ is O. Example: IᴬIᴼ × IᴮIᴼ gives gametes Iᴬ/Iᴼ and Iᴮ/Iᴼ; four combinations IᴬIᴮ, IᴬIᴼ, IᴮIᴼ, IᴼIᴼ predict AB, A, B and O in a 1:1:1:1 ratio.
- A sex-linked gene is on a sex chromosome, so the phenotype can be more common in one sex. Red-green colour blindness is an X-linked example. Worked cross: carrier female XᴺXⁿ × unaffected male XᴺY. Female gametes Xᴺ and Xⁿ; male gametes Xᴺ and Y. Offspring: XᴺXᴺ (unaffected daughter), XᴺXⁿ (carrier daughter), XᴺY (unaffected son), XⁿY (colour-blind son). Each is 1/4 expected; among sons, 1/2 are affected. Write chromosome/allele symbols in every cell before counting.
What to do in an assessment
- For protein questions, follow DNA base sequence → mRNA copy in nucleus → mRNA to ribosome → amino-acid sequence → protein shape/function. Distinguish mitosis (same chromosome number, identical cells) from meiosis (half chromosome number, different gametes). For ABO or sex linkage, list the actual gametes, construct every pairing and count phenotypes; do not assume a heterozygote looks recessive.
In plain language
Genes specify protein sequences; mitosis copies cells, meiosis makes varied haploid gametes, and extended crosses include codominant and sex-linked alleles.
Self-check
Cross a carrier female XᴺXⁿ with an unaffected male XᴺY. List all four possible children and the fraction of sons expected to be colour-blind.
Show the answer
Female gametes are Xᴺ and Xⁿ; male gametes are Xᴺ and Y. The combinations are XᴺXᴺ, XᴺXⁿ, XᴺY and XⁿY, each 1/4. One of the two possible sons is XⁿY, so 1/2 of sons are expected to be colour-blind.
Topic group
Topic 18 Core
- Course content
Scope: Course content · Subject-content route: any of Core, Extended (Core and Supplement) · Practical examination: any of Paper 5: Practical Test, Paper 6: Alternative to Practical · §3 Topic 18 Variation and selection: §18.1 Core 1; §18.1 Core 2; §18.1 Core 3; §18.1 Core 4; §18.1 Core 5; §18.1 Core 6; §18.1 Core 7; §18.1 Core 8; §18.2 Core 1; §18.2 Core 2; §18.3 Core 1(a); §18.3 Core 1(b); §18.3 Core 1(c); §18.3 Core 1(d); §18.3 Core 1(e); §18.3 Core 2(a); §18.3 Core 2(b); §18.3 Core 2(c); §18.3 Core 3
Open revision guidance
What to know
- Variation means differences between individuals of the same species. Continuous variation spans a range (for example, body mass or length) and is influenced by genes and environment; discontinuous variation has distinct categories with no intermediates (for example, ABO group or pea seed shape/colour) and is usually genetic only. To investigate, collect the same measurement from a sample for continuous variation and tally named categories for discontinuous variation; use consistent measurement technique, adequate sample size and a frequency table/histogram or category tally as appropriate.
- A mutation is genetic change and the source of new alleles. Ionising radiation and some chemicals increase mutation rate; they do not direct an organism to acquire a useful change. An adaptive feature is an inherited feature that helps survival and reproduction in an environment. In an unfamiliar case, quote the environmental challenge and the feature’s functional effect. For example, a cactus’s thick cuticle and reduced leaves limit water loss in a dry habitat; a floating aquatic leaf can have air spaces that aid buoyancy.
- Natural selection: populations contain inherited genetic variation; more offspring are produced than can survive; individuals compete for limited resources; those with advantageous features are more likely to survive and reproduce; they pass associated alleles to offspring, so those alleles become more common over generations. Selective breeding is artificial: people choose parents with desired traits, cross them, select desirable offspring, and repeat over generations. It can improve crop yield or livestock productivity, but may narrow genetic variation and increase vulnerability to disease.
- Worked stimulus for the source wording “images or other information” (hypothetical classroom example, not a report about an actual species): field notes describe Species X in a dry, sunny habitat; it has narrow leaves, a thick waxy surface and a swollen green stem. Interpretation: the thick waxy surface and reduced leaf area limit water loss; stored water in the stem helps it survive dry periods. Name the observed feature first, then link it to the environmental challenge and survival/reproduction. For variation practice, hypothetical sample observations (invented teaching data): body masses in g = 12, 13, 14, 17, 18, 20 (a range: continuous); pea seeds counted as 7 round and 5 wrinkled (separate categories: discontinuous). These are not official or published measurements. No variation graph is specified by these outcomes; investigate/describe the examples using consistent measurement and category tallies.
What to do in an assessment
- Classify data by asking whether values form a range or separate classes, then link the pattern to genes/environment. For adaptation, connect feature → functional advantage in the stated habitat. For selection, write the complete variation-to-inherited-frequency chain; for selective breeding, identify the human-selected parents and selected offspring over repeated generations.
In plain language
Variation supplies differences on which selection can act; an inherited advantage can become more common across generations.
Self-check
A sample of 40 plants has heights from 12 cm to 38 cm, while the same plants have either purple or white flowers. Classify the two characteristics and give a cause for each pattern.
Show the answer
Height is continuous because it spans a range and is affected by both genes and environment. Flower colour here is discontinuous because it falls into separate categories; it is usually caused by genes only.
Topic group
Topic 18 Supplement
- Course content
Scope: Course content · Subject-content route: Extended (Core and Supplement) · Practical examination: any of Paper 5: Practical Test, Paper 6: Alternative to Practical · §3 Topic 18 Variation and selection: §18.1 Supplement 9; §18.1 Supplement 10; §18.2 Supplement 3; §18.3 Supplement 4; §18.3 Supplement 5; §18.3 Supplement 6
Open revision guidance
What to know
- A gene mutation is a random change in the base sequence of DNA. Mutation creates new alleles. Genetic variation in a population also comes from meiosis, random mating and random fertilisation: they produce new allele combinations without an individual needing to change in response to need.
- Hydrophyte adaptations suit abundant water: for example, floating leaves may be broad with stomata mainly on the upper surface, and air spaces aid flotation/gas movement. Xerophytes face water shortage: examples include a thick waxy cuticle, reduced leaves/spines, sunken stomata, water-storing tissues and extensive roots. In each case explain how a feature improves survival in that specific environment; do not merely list it.
- Adaptation is the population-level process by which natural selection makes populations more suited to their environment over many generations. Antibiotic-resistant strains develop by the same selection logic: random resistant variants exist; antibiotic exposure kills susceptible bacteria more readily; resistant bacteria survive and reproduce; their resistance alleles become more frequent. Natural selection has environmental pressures and no deliberate chooser; artificial selection has humans choosing parents/offspring for desired traits. Both alter which inherited characteristics become common across generations, but their selecting agents differ.
What to do in an assessment
- For an adaptation explanation, name the feature and connect its effect to water availability. In selection examples distinguish random source of variation from the selective pressure and inherited outcome. State “more common over generations”, not that every individual transforms.
In plain language
Mutations and sexual reproduction generate variation; natural selection changes allele frequencies as environments favour some variants.
Self-check
In a dry habitat, explain why a plant with a thick waxy cuticle may leave more offspring than one without it.
Show the answer
The thick waxy cuticle reduces water loss by evaporation. In a dry habitat this helps the plant maintain water, survive and reproduce; if the feature is inherited, its allele can be passed to offspring and become more common over generations.
Topic group
Topic 19 Core
- Course content
Scope: Course content · Subject-content route: any of Core, Extended (Core and Supplement) · Practical examination: any of Paper 5: Practical Test, Paper 6: Alternative to Practical · §3 Topic 19 Organisms and their environment: §19.1 Core 1; §19.1 Core 2; §19.2 Core 1; §19.2 Core 2; §19.2 Core 3; §19.2 Core 4; §19.2 Core 5; §19.2 Core 6; §19.2 Core 7; §19.2 Core 8; §19.2 Core 9; §19.2 Core 10; §19.2 Core 11; §19.2 Core 12; §19.2 Core 13; §19.2 Core 14; §19.3 Core 1; §19.4 Core 1; §19.4 Core 2; §19.4 Core 3; §19.4 Core 4; §19.4 Core 5; §19.4 Core 6
Open revision guidance
What to know
- The Sun is the principal energy input to biological systems. Producers capture light in photosynthesis and store chemical energy in organic molecules; feeding transfers chemical energy through consumers and decomposers. At each transfer, energy is used in respiration and dissipated to the environment as heat; material in uneaten parts and waste also carries energy away from the next trophic level. Energy flows and is eventually transferred to the environment; it is not recycled like matter.
- A food chain shows energy transfer from a producer to consumers; arrows point from the organism eaten to the eater. A food web is interconnected chains. Producers make organic nutrients (usually by photosynthesis); consumers feed on organisms; primary, secondary, tertiary and quaternary consumers occupy successive feeding positions. Herbivores eat plants, carnivores eat animals, and decomposers obtain energy from dead/waste organic material. Trace all affected links to explain overharvesting or an introduced species: removing a prey species can reduce its predators and release organisms it previously ate.
- Pyramids: numbers count organisms at each trophic level; biomass compares total dry mass per area; bars represent trophic levels, with producers at the base. Numbers can be inverted (one tree can support many insects), whereas biomass better represents material present but can vary with sampling time. Energy pyramids show energy transferred per area per time, always narrow upward and best represent flow/efficiency; biomass and numbers are standing quantities. For example, if producers hold 20 000 kJ m⁻² year⁻¹ and primary consumers receive 2 000, transfer efficiency is (2 000 ÷ 20 000) × 100 = 10%. Because much energy is lost at each transfer, chains usually have fewer than five trophic levels and eating crop plants directly is more energy-efficient than feeding them to livestock first.
- The carbon cycle: photosynthesis removes carbon dioxide and makes organic molecules; feeding transfers carbon; respiration and decomposition return carbon dioxide; some dead material forms fossil fuels over long periods; combustion releases their carbon dioxide. A population is one species in one area at one time; a community is all populations of different species; an ecosystem includes that community and its interacting environment. Food supply, competition, predation and disease affect population growth. A sigmoid curve has lag, exponential/log, stationary and death phases; interpret it by reading axes, identifying where rate changes, and relating changes to resource limitation.
- Worked food-web diagram in arrows (hypothetical habitat; arrows point from food to consumer): grass → grasshopper → frog → snake; grass → rabbit → fox; grasshopper → bird → snake. If grasshoppers decline, frogs and insect-eating birds may have less food; frogs may also provide less food to snakes. Human-impact application (hypothetical): overharvesting rabbits reduces fox food, while an introduced predator that eats frogs can reduce frogs and alter food available to snakes. Trace arrows both downstream to predators and backward to the food organisms released from predation. A simple numbers pyramid example is 1000 grass plants → 100 grasshoppers → 10 small birds; a corresponding hypothetical biomass set might be 10 000 g → 1 000 g → 100 g. Bars should be stacked by trophic level, with the producer base widest in this example. These invented values are solely practice, not official ecosystem measurements. Numbers can be inverted in a tree-based chain, which is one reason biomass can represent feeding material more usefully.
- Worked population-curve interpretation for the same hypothetical habitat (grasshopper counts, not official statistics): day 0 = 10, day 2 = 14, day 4 = 29, day 6 = 58, day 8 = 95, day 10 = 100, day 12 = 100, day 14 = 72. If plotted as population size against time, the slow initial rise is lag, the rapid rise is exponential/log, the near-constant 95–100 interval is stationary, and the fall to 72 is a death/decline phase. Read axes and intervals before naming phases; explain a plateau or fall using limiting factors such as food, competition, predation or disease. The keyed population-growth gallery plots these exact observations as an actual graph; use its unlabelled practice mode before consulting the closed key.
What to do in an assessment
- On a chain/web, follow arrow direction and identify each trophic role before predicting indirect effects. For pyramid questions, identify whether the bars show number, biomass or energy and include the unit/area/time basis if provided. For transfer efficiency calculate (energy at next level ÷ energy at previous level) × 100. On a population curve, read the axes, locate phase transitions, then explain changes using food, competition, predation, disease and other limiting resources.
In plain language
Energy enters mainly from the Sun and moves through feeding relationships; populations and nutrient cycles interact within ecosystems.
Self-check
A producer level contains 12 000 kJ and the primary-consumer level contains 1 800 kJ. Calculate transfer efficiency and state why the next level contains less energy.
Show the answer
Efficiency = (1 800 ÷ 12 000) × 100 = 15%. Some energy is used in respiration and lost as heat; other energy is in uneaten material or waste, so less is transferred to the next trophic level.
View diagrams
Food web Food webHypothetical habitat · schematic, not to scaleTarget Organism Trophic role A ________________ ________________ B ________________ ________________ C ________________ ________________ D ________________ ________________ E ________________ ________________ F ________________ ________________ G ________________ ________________ Food → Consumer A B B C C D A E E F B G G D Show labelled key: Answer key for food-web
Food web Food webHypothetical habitat · schematic, not to scaleTarget Organism Trophic role A Grass Producer B Grasshopper Primary consumer C Frog Secondary consumer D Snake Tertiary consumer E Rabbit Primary consumer F Fox Secondary consumer G Bird Secondary consumer Food → Consumer Grass Grasshopper Grasshopper Frog Frog Snake Grass Rabbit Rabbit Fox Grasshopper Bird Bird Snake Pyramids of numbers and biomass Pyramid of numbers
Pyramid of biomass
Hypothetical practice values only: not an actual ecosystem sample or official statistics. Numbers count organisms; biomass is total dry mass. Both examples show three trophic levels and use proportionally scaled bar widths.
Trophic level Number of organisms Biomass (g dry mass) Grass plants 1,000 10,000 Grasshoppers 100 1,000 Small birds 10 100 Show labelled key: Answer key for trophic-pyramids
Pyramids of numbers and biomass Pyramid of numbers
Pyramid of biomass
Hypothetical practice values only: not an actual ecosystem sample or official statistics. Numbers count organisms; biomass is total dry mass. Both examples show three trophic levels and use proportionally scaled bar widths.
Trophic level Number of organisms Biomass (g dry mass) Grass plants 1,000 10,000 Grasshoppers 100 1,000 Small birds 10 100 Population growth over time Population growth over timeShared hypothetical habitat: grasshopper population; straight joins, no extra observationsTime (days) Population (organisms) 0 10 2 14 4 29 6 58 8 95 10 100 12 100 14 72 Show labelled key: Answer key for population-growth
Population growth over time Population growth over timeShared hypothetical habitat: grasshopper population; straight joins, no extra observationsTime (days) Population (organisms) 0 10 2 14 4 29 6 58 8 95 10 100 12 100 14 72 Interpret the food web, linked grass/grasshopper/small-bird pyramids, and grasshopper population curve as one hypothetical habitat dataset; practice and key modes share the same values.
Topic group
Topic 19 Supplement
- Course content
Scope: Course content · Subject-content route: Extended (Core and Supplement) · Practical examination: any of Paper 5: Practical Test, Paper 6: Alternative to Practical · §3 Topic 19 Organisms and their environment: §19.2 Supplement 15; §19.2 Supplement 16; §19.2 Supplement 17; §19.2 Supplement 18; §19.2 Supplement 19; §19.3 Supplement 2; §19.3 Supplement 3; §19.4 Supplement 7
Open revision guidance
What to know
- Energy transfer is often inefficient because organisms use chemical energy in respiration (released as heat), do not digest/assimilate all food, and lose energy in faeces, urine or uneaten parts. Less energy remains as biomass available to the next trophic level. Thus few chains have five or more levels. Humans obtain more of crop energy by eating plants directly than by feeding crops to livestock first, because each extra trophic transfer loses energy.
- Nitrogen cycle sequence: decomposers break down plant/animal protein to ammonium ions; nitrifying microorganisms convert ammonium to nitrate; nitrogen fixation by lightning and bacteria adds usable nitrogen compounds; plants absorb nitrate and make amino acids/proteins; animals feed and digest protein; deamination removes the amino group from excess amino acids; denitrifying microorganisms return nitrogen from nitrate to the atmosphere. The named microorganism roles are decomposition, nitrification, nitrogen fixation and denitrification; memorising species names is not required.
- A sigmoid population curve: lag phase has slow growth while organisms establish/reproduce; exponential phase has rapid growth while resources are plentiful; stationary phase occurs as limiting factors such as food, space, competition, predation or disease balance births; death phase occurs when deaths exceed births, often as resources become severely limiting. The exact cause depends on the data/context.
What to do in an assessment
- For energy-loss questions name where energy goes rather than just saying “energy is lost”. For the nitrogen cycle, keep the ion names and process order clear: protein → ammonium → nitrate → plant protein → animal protein → deamination, with fixation adding and denitrification returning nitrogen. For each sigmoid phase, state the population trend and a matching resource/limiting-factor explanation.
In plain language
Nitrogen cycles through organisms, ions and the atmosphere; energy is lost at each feeding step, limiting food-chain length.
Self-check
Plants absorb nitrate, an animal eats the plant, and decomposers act after it dies. Name the next nitrogen-cycle form after decomposition and the process that can return nitrogen to the atmosphere.
Show the answer
Decomposition of the plant/animal protein produces ammonium ions. Denitrification by microorganisms converts nitrate to nitrogen returned to the atmosphere.
Topic group
Topic 20 Core
- Course content
Scope: Course content · Subject-content route: any of Core, Extended (Core and Supplement) · Practical examination: any of Paper 5: Practical Test, Paper 6: Alternative to Practical · §3 Topic 20 Human influences on ecosystems: §20.1 Core 1(a); §20.1 Core 1(b); §20.1 Core 1(c); §20.1 Core 1(d); §20.1 Core 1(e); §20.1 Core 2; §20.1 Core 3; §20.2 Core 1; §20.2 Core 2(a); §20.2 Core 2(b); §20.2 Core 2(c); §20.2 Core 3; §20.2 Core 4; §20.3 Core 1; §20.3 Core 2; §20.3 Core 3; §20.4 Core 1; §20.4 Core 2; §20.4 Core 3; §20.4 Core 4(a); §20.4 Core 4(b); §20.4 Core 4(c); §20.4 Core 4(d)
Open revision guidance
What to know
- Food production rises through machinery (cultivates larger areas/more efficiently), chemical fertilisers (replace mineral nutrients and improve yields), insecticides (reduce crop damage), herbicides (reduce weed competition), and selective breeding (improves crop or livestock traits). A large monoculture simplifies planting/harvesting and can yield efficiently, but low crop diversity can allow a pest/disease to spread widely and repeated inputs can affect ecosystems. Intensive livestock production can use space/feed efficiently and provide predictable output, but crowding creates welfare/disease concerns and concentrated waste/pollution; balance benefits and costs in context.
- Biodiversity is the number of different species living in an area. Habitat destruction arises from land conversion for housing, crop and livestock production, resource extraction and freshwater/marine pollution. Changing food chains/webs can reduce prey, predators or competitors and harm habitats. Deforestation reduces habitats and biodiversity and can cause extinction; exposed soil is eroded, less water is intercepted/infiltrated so flooding may increase, and less carbon is stored while burning/decay releases carbon dioxide, increasing atmospheric CO₂.
- Untreated sewage adds organic matter and microorganisms; decomposition/respiration uses dissolved oxygen, harming aquatic organisms. Excess fertiliser adds nutrients and can trigger algal/producer growth followed by oxygen depletion as biomass dies and decomposes. Non-biodegradable plastics persist, entangle or are eaten by organisms in aquatic and terrestrial habitats and can enter food chains. Methane and carbon dioxide arise from sources including combustion/fossil fuels, livestock and decomposition; increased concentrations strengthen the greenhouse effect and contribute to climate change.
- A sustainable resource is replaced as rapidly as it is removed so it does not run out. Forest and fish resources can be managed sustainably. Organisms become endangered/extinct through climate change, habitat destruction, hunting, overharvesting, pollution and introduced species. Conservation may monitor/protect species and habitats, educate communities, breed endangered organisms in captivity and store seeds in seed banks. These approaches address threats while preserving remaining populations.
What to do in an assessment
- For a food-production technique, identify its direct yield benefit and a context-specific cost. For deforestation/pollution, build a cause → ecological process → consequence chain. For conservation, pair the threat with an intervention and explain how it sustains a resource or protects an organism.
In plain language
Food production can increase yields but environmental pressures alter habitats; sustainability means removal does not outpace replacement.
Self-check
Explain two ways deforestation can harm ecosystems, linking each cause to a consequence.
Show the answer
Removing trees destroys habitats, so species may decline or become extinct and biodiversity falls. Without tree roots and canopy, soil is less held in place and less rainfall is intercepted, increasing erosion and flood risk; loss of stored carbon or burning also raises atmospheric carbon dioxide.
Topic group
Topic 20 Supplement
- Course content
Scope: Course content · Subject-content route: Extended (Core and Supplement) · Practical examination: any of Paper 5: Practical Test, Paper 6: Alternative to Practical · §3 Topic 20 Human influences on ecosystems: §20.3 Supplement 4; §20.4 Supplement 5; §20.4 Supplement 6; §20.4 Supplement 7(a); §20.4 Supplement 7(b); §20.4 Supplement 7(c); §20.4 Supplement 7(d); §20.4 Supplement 8; §20.4 Supplement 9
Open revision guidance
What to know
- Eutrophication sequence: fertiliser runoff raises nitrate and other ion availability; producers (especially algae) grow rapidly; many die; decomposers break down the dead biomass and increase aerobic respiration; dissolved oxygen falls; organisms that require oxygen die. Explain the causal sequence rather than stating only “algae use oxygen”.
- Forests can be conserved through education, protected areas, quotas on harvesting and replanting. Fish stocks can be conserved through education, closed seasons during reproduction, protected areas, controlled net types and mesh sizes that allow young fish to escape, quotas and monitoring. Each measure limits removal, enables reproduction or checks whether stocks recover.
- Conservation programmes maintain/increase biodiversity, reduce extinction risk, protect vulnerable ecosystems and maintain ecosystem functions such as nutrient cycling and provision of resources including food, drugs, fuel and genes. Captive breeding can use artificial insemination (sperm introduced to a female’s reproductive tract) or IVF (egg and sperm fertilise outside the body; an embryo is transferred) when natural mating is difficult. If a population becomes small, fewer alleles may remain and relatives are more likely to breed; reduced genetic variation makes the species less able to respond to environmental change or disease. Genetic drift detail is not required.
What to do in an assessment
- For eutrophication, use the complete ordered chain from nutrient input to death of oxygen-dependent organisms. For forest/fish management, connect each measure to reduced harvest or recovery. When discussing a small population, distinguish the risk (loss of variation) from its consequence (less capacity to respond); do not introduce unrequired genetic-drift detail.
In plain language
Conservation controls resource use and protects biodiversity; nutrient runoff can trigger a chain ending in oxygen depletion.
Self-check
A fertiliser spill enters a lake. Give the ordered events that can lead to fish deaths.
Show the answer
Nitrate/other ions become more available; algae and other producers grow rapidly; they die; decomposers break them down and respire aerobically; dissolved oxygen falls; fish and other organisms requiring dissolved oxygen die.
Topic group
Topic 21 Core
- Course content
Scope: Course content · Subject-content route: any of Core, Extended (Core and Supplement) · Practical examination: any of Paper 5: Practical Test, Paper 6: Alternative to Practical · §3 Topic 21 Biotechnology and genetic modification: §21.1 Core 1; §21.2 Core 1; §21.2 Core 2; §21.2 Core 3; §21.2 Core 4; §21.3 Core 1; §21.3 Core 2(a); §21.3 Core 2(b); §21.3 Core 2(c); §21.3 Core 2(d)
Open revision guidance
What to know
- Bacteria are useful in biotechnology/genetic modification because they reproduce rapidly and can make complex molecules. Anaerobic respiration by yeast produces ethanol and carbon dioxide: ethanol is collected as a biofuel; in bread dough, carbon dioxide bubbles make the dough rise and ethanol evaporates during baking. Pectinase breaks down pectin in fruit cell walls, helping release juice and improve yield/clarity.
- Biological washing powders contain enzymes that break down stains. A fair investigation: cut equal cloth squares, apply equal amounts of a known stain, allow the same time to dry, then wash with equal volume/concentration of powder for equal time at the same measured temperature and agitation. Compare an enzyme detergent with an enzyme-free/control wash, repeat each treatment, and score stain remaining using the same scale or measure colour consistently. Keep fabric, stain, detergent amount, water volume, time and temperature controlled; handle hot water/detergents safely and follow product guidance.
- Genetic modification changes an organism’s genetic material by removing, changing or inserting individual genes. Examples include human genes inserted into bacteria to produce human proteins; crop genes for herbicide resistance or insect-pest resistance; and genes that improve nutritional qualities. These are distinct aims, and an exam response should state the gene change and intended characteristic.
What to do in an assessment
- For fermentation, name the organism, anaerobic conditions, substrate/product and use. For a washing-powder test, state the control, measured cleaning outcome, controlled variables, repeats and safe handling. For genetic modification examples, link an inserted/changed gene to the resulting useful feature.
In plain language
Microbes can produce useful substances at scale, and a genetic change can give an organism a chosen characteristic.
Self-check
A student compares enzyme washing powder with ordinary detergent. State a suitable control, two variables to keep constant, and how to compare results.
Show the answer
Use ordinary detergent without the tested enzyme as a control (or an identical wash without enzyme). Keep fabric/stain and stain amount, detergent mass/concentration, water volume, temperature, wash time and agitation constant. Repeat and compare remaining stain using the same scoring scale or a consistent colour measurement.
Topic group
Topic 21 Supplement
- Course content
Scope: Course content · Subject-content route: Extended (Core and Supplement) · Practical examination: any of Paper 5: Practical Test, Paper 6: Alternative to Practical · §3 Topic 21 Biotechnology and genetic modification: §21.1 Supplement 2(a); §21.1 Supplement 2(b); §21.2 Supplement 5; §21.2 Supplement 6; §21.2 Supplement 7; §21.3 Supplement 3(a); §21.3 Supplement 3(b); §21.3 Supplement 3(c); §21.3 Supplement 3(d); §21.3 Supplement 3(e); §21.3 Supplement 3(f); §21.3 Supplement 4
Open revision guidance
What to know
- Bacteria have plasmids, small circular DNA molecules that can carry inserted genes. Their rapid reproduction can generate many copies quickly and they can make complex proteins. Their manipulation/growth raises relatively few ethical concerns compared with many animal interventions, though biosafety and responsible containment still matter.
- Lactase hydrolyses milk sugar lactose into glucose and galactose, producing lactose-free/reduced-lactose milk. Fermenters enable large-scale production by bacteria or fungi of useful products including insulin, penicillin and mycoprotein. Control temperature near the organism/enzyme optimum, pH, oxygen supply where aerobic growth is needed, nutrient supply and removal/control of waste products; sensors and mixing help maintain conditions. Sterility reduces contamination, which competes for substrate or spoils product.
- Recombinant human-protein process: isolate DNA containing the human gene using a restriction enzyme, leaving sticky ends; cut a bacterial plasmid with the same enzyme so its ends are complementary; join gene and plasmid with DNA ligase to form a recombinant plasmid; insert plasmids into bacteria; grow/multiply bacteria carrying them; bacteria express the human gene and make its protein. The matched sticky ends allow base pairing and ligase seals the DNA backbone. Crop GM examples include herbicide-resistant soya, insect-resistant maize and nutritionally improved rice, as well as genes for herbicide resistance, insect-pest resistance or improved nutritional quality in crops. Potential advantages include reliable yield, reduced crop loss and improved nutrient content; disadvantages/risks include gene escape to wild relatives, effects on non-target organisms, resistant pests/weeds, reduced biodiversity and dependence on seed suppliers. Evaluate both sides for the named crop and trait rather than asserting all GM crops have the same effect.
What to do in an assessment
- In a fermenter answer, name each controlled condition and why it matters to growth/product yield or contamination. For recombinant DNA, preserve the order: isolate/cut human gene → cut plasmid with same enzyme → ligase → insert into bacteria → multiply → express. In crop evaluations distinguish a potential benefit from a possible environmental/economic risk.
In plain language
Plasmids can carry a human gene into bacteria; controlled growth lets microbes make useful products in bulk.
Self-check
Put the recombinant-protein steps in order after choosing a human gene: ligase joins DNA; cut plasmid with the same restriction enzyme; bacteria express the gene; insert plasmid into bacteria; isolate human gene with sticky ends; multiply bacteria; form recombinant plasmid.
Show the answer
Isolate the human gene with a restriction enzyme to form sticky ends; cut the plasmid with the same enzyme; join gene and plasmid with DNA ligase to form a recombinant plasmid; insert it into bacteria; multiply the bacteria; the bacteria express the human gene and make the protein.
Topic group
Assessment and route
- Course content
Scope: Course content · Subject-content route: any of Core, Extended (Core and Supplement) · Practical examination: any of Paper 5: Practical Test, Paper 6: Alternative to Practical · §2 assessment overview and §4, pp. 9, 49–50; 0610 award and entry rules
Open revision guidance
What to know
- All candidates take three examined components. Core: Paper 1 multiple choice (40 marks, 45 min) and Paper 3 theory (80 marks, 1 h 15 min); Core questions assess Core only and grades C–G. Extended: Paper 2 multiple choice and Paper 4 theory, same durations/marks; questions assess Core plus Supplement and grades A*–G. Source guidance: Core for candidates expected D or below; Extended for candidates expected C or above. Core learners can achieve at most C.
- Every candidate also chooses Paper 5 Practical Test (40 marks, 1 h 15 min, laboratory experiments) or Paper 6 Alternative to Practical (40 marks, 1 h, no experiments performed). Both test AO3 across the full grade range and require the same experimental skills/contexts. AO1 is knowledge and understanding, AO2 handling information/problem-solving, AO3 experimental skills. This is the 0610 A*–G route, not 0970’s 9–1 award.
What to do in an assessment
- Check that the registered papers match the studied content and one practical choice; do not call Core ‘Foundation’ or Extended ‘Higher’.
In plain language
The code 0610 uses Core or Extended theory papers plus one of two practical examinations.
Self-check
Which papers should a candidate studying Core take, and what is the maximum grade available on that route?
Show the answer
Paper 1 and Paper 3, plus Paper 5 or 6. The syllabus states Core candidates are eligible for C to G, so the maximum is C.
Topic group
Assessment and weighting
- Course content
Scope: Course content · Subject-content route: any of Core, Extended (Core and Supplement) · Practical examination: any of Paper 5: Practical Test, Paper 6: Alternative to Practical · §2 assessment overview, pp. 9–10; §4, pp. 49–50
Open revision guidance
What to know
- Paper 1 or 2 contributes 30% (40 marks, 45 minutes); Paper 3 or 4 contributes 50% (80 marks, 1 hour 15 minutes); Paper 5 or 6 contributes 20% (40 marks; Paper 5 is 1 hour 15 minutes, Paper 6 is 1 hour). AO weight across the qualification: AO1 knowledge/understanding 50%, AO2 handling information/problem-solving 30%, AO3 practical skills/investigations 20%. In Papers 1–4, AO1 is approximately 63% and AO2 37%; Papers 5–6 assess AO3 only. For 0610, Core entries are eligible C–G; Extended (Core plus Supplement) A*–G. The subject-content route and one practical component are separate selections.
What to do in an assessment
- Before an exam, identify route, theory components and practical choice separately; interpret component weight as a percentage of the qualification and AO weight as a percentage within the named scope.
In plain language
Theory contributes 80% and one practical paper contributes 20%; the AOs describe what each paper assesses.
Self-check
A learner studies Core and selects Paper 6. Which theory papers are required, how much does Paper 6 contribute, and which AO does it test?
Show the answer
Papers 1 and 3; Paper 6 contributes 20% and tests AO3 experimental skills/investigations.
Topic group
Mathematics and data
- Course content
Scope: Course content · Subject-content route: any of Core, Extended (Core and Supplement) · Practical examination: any of Paper 5: Practical Test, Paper 6: Alternative to Practical · §4, pp. 54–57, and §5, p. 58; mathematical requirements, data conventions and command words
Open revision guidance
What to know
- Calculate with decimals, fractions, ratios, reciprocals, percentages/change, standard form, significant figures and decimal places; rearrange simple formulae and use direct/inverse proportion. Convert units (cm³/dm³, mass, µm–m); use area/volume formulae, scale diagrams and surface-area:volume ratio. Plot/interpret line, bar, pie and histogram charts; choose scales/axes, calculate mean/range, probability, gradient/intercept with units, and interpolate/extrapolate.
- Record readings to instrument precision; put quantity/unit in headings such as time / s, not in table cells. Label graph axes with quantity and unit, independent x/dependent y, use sensible scales and accurate points, draw an appropriate best-fit line/curve and identify anomalies. Biological drawings use fine unbroken pencil lines, observed proportions, no shading, ruler label lines touching the feature. Use bars for discrete categories (separate bars), histograms for continuous data (touching bars). Understand calculate, compare, define, describe, determine, evaluate, explain, give, identify, outline, predict, sketch, state and suggest.
- Number and algebra worked methods: show all four operations with decimals/fractions; convert ratios to a consistent form and use reciprocals; percentage change = (final − initial) ÷ initial × 100. For example, a mass change from 2.0 g to 2.5 g is 25%. Write 0.00032 as 3.2 × 10⁻⁴; round 12.678 to 3 significant figures as 12.7 or to 2 decimal places as 12.68, as requested. Use direct proportion when doubling one quantity doubles another; use inverse proportion when doubling one quantity halves another. Rearrange a simple formula by doing the same operation to both sides, then substitute values with units; magnification = image size ÷ actual size, so image 6 mm and actual 0.12 mm gives ×50. Measurement and geometry: convert units before calculating (0.42 mm = 420 μm; 1 dm³ = 1000 cm³); measure with a ruler from zero and estimate sensibly. Rectangle area = length × width; triangle area = base × perpendicular height ÷ 2; circle area = πr². Rectangular-block volume = length × width × height; cylinder volume = πr²h. For a specimen with surface area 6 mm² and volume 2 mm³, surface area ÷ volume = 3 mm⁻¹ when lengths are measured in millimetres; report units consistently. Read scale diagrams using the drawing scale and report a suitable SI/approved unit. Define geometric terms such as radius, diameter, circumference, perpendicular height and area when they determine a calculation. Graphs, statistics and data conventions: place the independent variable on x and dependent on y; axes carry quantity/unit, table headings use quantity / unit and units do not repeat in body cells. Record every reading to instrument precision and use consistent significant figures. Use a line graph for continuous paired data, separated equal-width bars for discrete categories, a pie chart for proportions (sector angle = fraction × 360°), and touching bars/equal class intervals for continuous-data histograms. Choose scales spanning most of the graph, plot accurately and draw one thin smooth best-fit line/curve; identify anomalies rather than silently deleting them. Interpolate within data and extrapolate beyond cautiously. Gradient = change in y ÷ change in x using a large triangle and report the compound unit; for 24 cm³ over 8 min, gradient = 3 cm³ min⁻¹. State whether a graph shows direct proportionality (straight line through origin). Mean = total ÷ number; range = maximum − minimum; simple probability = favourable outcomes ÷ total equally likely outcomes. For example, values 4, 5, 9 have mean 6 and range 5. Biological drawing conventions: use sharp pencil, clear single unbroken lines, observed proportions and adequate space; no shading or colour; use ruled label lines that touch the intended feature and do not cross. A drawing is an observation, not an artistic reconstruction. Command words: calculate means derive a numerical answer with working; compare means identify similarities and/or differences; define gives a precise meaning; describe reports features or trends; determine finds an answer from information/data; evaluate weighs strengths/limitations against evidence; explain gives a reason or causal account; give states an answer without requiring explanation; identify names or locates; outline gives main features; predict states an expected result from evidence; sketch shows main features without exact scale; state gives a concise fact; suggest applies knowledge to a new context. Use decimal points, consistent number grouping, defined variables and SI/approved units.
- Exact graph and conventions checks: use more than half the grid in both directions when sensible, choose scales based on simple 1/2/5 intervals (for example 2 cm for 1, 2 or 5 units), and remember axes need not start at zero. Mark plotted points as crosses or circled dots; each should be accurate to half a smallest grid square. Draw one thin smooth straight line/curve only when intermediate values are reasonably predictable; with scatter, balance points on either side, ignore clearly anomalous points for the fit, and show construction when reading an interpolated/extrapolated value to half a smallest square. Recognise direct proportionality from a straight line through the origin and inverse proportionality from the relevant decreasing relationship. Use equal class intervals for histograms. Geometry vocabulary includes angle, curve, circle, radius, diameter, circumference, square, rectangle and diagonal; convert mg/g/kg, μm/mm/cm/m and cm³/dm³ before applying the source-required area/volume formulas. Use a single decimal point and source-consistent grouping (1000–9999 unseparated; ≥10 000 grouped with spaces), define variables, use consistent SI/approved units, and retain supplied units unless the question asks for conversion.
What to do in an assessment
- Show working and units; choose a graph suited to data type; calculate a gradient using a large triangle on the best-fit line, not two adjacent points.
- For every calculation show formula, substitution, unit and sensible rounding; for every graph/table identify variable roles, data type, scale/precision and evidence-based interpretation before writing the conclusion.
In plain language
Clear calculations and consistent data displays make biological evidence interpretable.
Self-check
A graph rises by 18 mm vertically over 6 mm horizontally. The vertical axis is oxygen volume / cm³ and the horizontal axis is time / min. What is the gradient and its unit?
Show the answer
Gradient = 18 ÷ 6 = 3; the unit is (cm³)/(min) = cm³ min⁻¹.
Topic group
Practical assessment
- Course content
Scope: Course content · Subject-content route: any of Core, Extended (Core and Supplement) · Practical examination: any of Paper 5: Practical Test, Paper 6: Alternative to Practical · §3 preface and §4, pp. 12, 50–53; practical contexts, skills, equipment and safety
Open revision guidance
What to know
- Both practical choices use the same contexts: quantitative measurements; diffusion, osmosis, food tests, enzyme rates/end-points, pH/indicators, photosynthesis, transpiration, heart/breathing rate, respiration, tropisms, seeds/flowers, germination and variation; representative sampling; unfamiliar specimens, biological drawings and magnification. Know safe, accurate use of apparatus/materials and the listed reagents/equipment, including balance, ruler, thermometer, measuring cylinder, syringe, pipette, timer, microscope/hand lens, cutting tools, Benedict’s, biuret, iodine, DCPIP and indicators.
- Plan by naming independent/dependent variables, controls/constants, range/repeats, method, control experiment, risks and prediction. Take precise readings, make qualitative observations and labelled tables with units; process and graph data; interpret patterns, interpolate/extrapolate and calculate gradients; support conclusions with evidence; identify anomalies/errors and evaluate improvements. Paper 5 requires laboratory work; Paper 6 assesses the same skills without candidates performing experiments.
- Equipment demonstration and selection: zero a balance before weighing, use a graduated measuring cylinder for liquid volume, read a ruler at eye level in millimetres, read a thermometer after equilibration, start/stop a stop-clock consistently, and use syringes or a pipette to transfer measured volumes without mouth pipetting. Identify the purpose and safe handling of beakers, test-tubes and racks, bungs/delivery tubes, funnels/filter paper, forceps, glass rods, hand lenses, lamps, needles/seeker, scissors, cutting/marking tools, dialysis tubing, Petri dishes, spotting tiles, wash bottle, white tile/cutting surface and millimetre ruler. Choose apparatus by the quantity, range and precision needed; label and draw apparatus clearly, keep glassware stable, cut away from fingers and follow local centre rules. Reagent demonstrations: iodine plus sample gives blue-black for starch; Benedict's plus sample must be heated in a hot-water bath for a reducing-sugar colour/precipitate; Biuret reagent gives lilac/purple for protein; ethanol followed by water gives a cloudy emulsion for fat/oil; blue DCPIP is decolourised by vitamin C. Demonstrate pH with universal indicator, litmus or other specified indicator; limewater tests carbon dioxide; hydrogencarbonate indicator compares carbon-dioxide conditions; hydrogen peroxide, methylene blue, petroleum jelly, sodium chloride and sodium hydrogencarbonate are used only in source-relevant investigations with the stated method. Use enzymes, water and food substances as controlled materials. Record the actual colour/observation before inferring a result. Safe-practical routine: read hazard information and method first; use appropriate eye protection and gloves where indicated; keep ethanol away from ignition and never heat it over a naked flame; use a water bath for Benedict's/ethanol procedures; use forceps or a holder for hot apparatus; never taste samples, mouth-pipette, or directly handle hazardous biological/chemical material. Identify the risk, the route of exposure, a specific precaution and disposal rule. For unfamiliar instructions, check apparatus connections/leaks and arrange equipment before starting. Worked method pattern across the syllabus contexts: state the independent variable, the measurable dependent variable, controlled variables, a useful range, repeats, apparatus and safety; include a control/comparison where it tests the claim. For diffusion, change one factor such as cube size and measure penetration; for osmosis, blot consistently and compare initial/final mass; for food/pH tests, use equal sample/reagent volumes and record qualitative endpoints; for enzyme rates, define a colour endpoint and keep pH/concentrations fixed; for photosynthesis, measure a stated proxy and control other limiting factors; for transpiration, distinguish potometer uptake from water loss; for heart/breathing/respiration, standardise interval and activity safely; for tropisms, use matched illuminated/control seedlings; for seed/flower dissection, use a tray, forceps and clear observed line drawing; for germination, vary a stated condition while holding others constant; for variation, use a representative sample and simple random selection to reduce bias. Repeat measurements, tabulate to instrument precision, plot suitable graphs, identify anomalies, support conclusions with data, then connect each limitation/error to a specific improvement. Paper 5 requires laboratory performance; Paper 6 assesses the same experimental contexts and skills from provided information without candidate experiment performance.
- Exact apparatus familiarity and demonstrations: the listed balance measures up to 500 g with precision of at least 0.1 g; demonstrate zeroing and recording to 0.1 g. Graduated rulers read millimetres; hand lenses provide at least ×6; stop-clocks read to 1 s or better; thermometers span −10°C to +110°C with 1°C graduations; syringes include 1, 5 and 10 cm³; measuring cylinders include 10, 25 and 100 cm³. Recognise standard/large test tubes (125 × 15 mm and 150 × 25 mm), matching bungs and delivery tubes, filter funnels/paper, forceps, glass rods, lamps, scalpels/sharp knives, glassware markers, mounted needles/seekers/pins, scissors, partially permeable membrane tubing, Pasteur/dropper pipettes, Petri dishes, spotting tiles, racks/holders, wash bottles, white tiles and cutting surfaces. Practise reading diagrams of analogue/digital instruments and choosing a scale whose resolution matches the required quantity/range. Examine each chemical hazard instruction: hazard codes C = corrosive, HH = health hazard, MH = moderate hazard, T = acutely toxic, F = flammable, O = oxidising, N = hazardous to the aquatic environment; learn these meanings but note that the syllabus says candidates are not assessed on the codes. Centres are responsible for local rules, first aid, disposal, current hazard data and providing suitable eye protection/gloves; actual exam hazards are specified in the confidential instructions.
- Worked safe classroom protocols tied to the source practical outcomes: (1) Osmosis with plant tissue—prepare labelled distilled-water and teacher-prepared sodium-chloride solutions, use equal-sized potato strips, measure and record initial mass, immerse each for the same time/temperature, blot each in the same way, then record final mass. Use several concentrations, at least three replicates, keep strip dimensions and solution volume constant, and calculate percentage mass change = (final − initial) ÷ initial × 100; wear eye protection, do not taste material, and dispose/clean as directed. A result such as 2.00 g to 2.20 g is +10.0%. (2) Amylase/starch rate—use equal volumes/concentrations, keep pH and temperature constant, start timing on mixing, transfer a drop at regular intervals to iodine on a spotting tile with a clean pipette, stop at a pre-defined endpoint and repeat; iodine is applied to the tile, not added back to the reaction, and goggles/gloves and teacher-approved enzyme handling are used. Record time to endpoint and compare rates as 1/time only when the same endpoint/method is used. For either method, include the independent/dependent variables, constants, a suitable control, a labelled results table with units, repeats, data-based conclusion, anomaly and a linked improvement; Paper 6 questions test equivalent planning/interpretation without the candidate performing the experiment.
What to do in an assessment
- Change one independent variable, measure a defined outcome, control relevant factors, repeat and record to instrument precision; justify apparatus and safety. When evaluating, connect an error to its effect and propose a specific improvement.
- Demonstrate the apparatus/reagent routines described in the teaching points before assessment; for each unfamiliar practical, rehearse the full cycle: select and check equipment → work safely → record precise observations → process/analyse → conclude from evidence → evaluate a specific error and improvement.
In plain language
Practical questions reward a controlled method, safe measurements, clear records and evidence-based evaluation.
Self-check
A student tests how temperature affects amylase rate. Name one independent variable, one dependent variable, two controls and a useful improvement.
Show the answer
Independent: temperature; dependent: time for starch to disappear or product formed per time; controls: pH and enzyme/substrate concentrations (also volumes). Repeat at each temperature and calculate a mean; use a thermostatically controlled water bath and a clear colour end-point.
Topic group
Reviewed requirements
- Course content
Scope: Course content · Subject-content route: any of Core, Extended (Core and Supplement) · §3 Topic 7 §7.2 Core 1(a–b) — actual-image identification of alimentary-canal and accessory digestive organs, distinct from schematic diagrams.
Open revision guidance
What to know
- The Blausen 3D medical illustration is a real sourced image with printed labels for the mouth, salivary glands, oesophagus (printed “Esophagus”), stomach, liver, gallbladder, pancreas, small and large intestine, and anus. Use it for actual-image recognition of those named structures, paired with the full alimentary-system schematic and key for the complete source-target practice. The illustration does not separately label finer divisions such as the duodenum, ileum, colon or rectum; these are practised on the schematic. The torso-model photograph is optional contrast only and cannot reliably identify named digestive organs.
What to do in an assessment
- Inspect the printed labels on the Blausen image and match each named organ to its position; read printed “Esophagus” as syllabus “oesophagus.” Then cover and practise the same source targets on the paired full alimentary-system schematic before revealing its key, including finer divisions not separately labelled in the Blausen image. The torso model is contrast only, not evidence for naming individual organs.
In plain language
Practise named-organ recognition on the labelled Blausen 3D image and use the full schematic for finer digestive structures; the torso model is only a contrast image.
Self-check
How do the labelled Blausen 3D image and the full alimentary schematic work together for recognition practice?
Show the answer
The Blausen image provides a sourced, labelled real-image view of the mouth, salivary glands, oesophagus, stomach, liver, gallbladder, pancreas, small and large intestine, and anus. Use the full schematic and key for the complete source-target practice, including finer divisions not separately labelled on the image. Do not use the torso model to name organs.
View diagrams
Digestive system: Blausen medical illustration
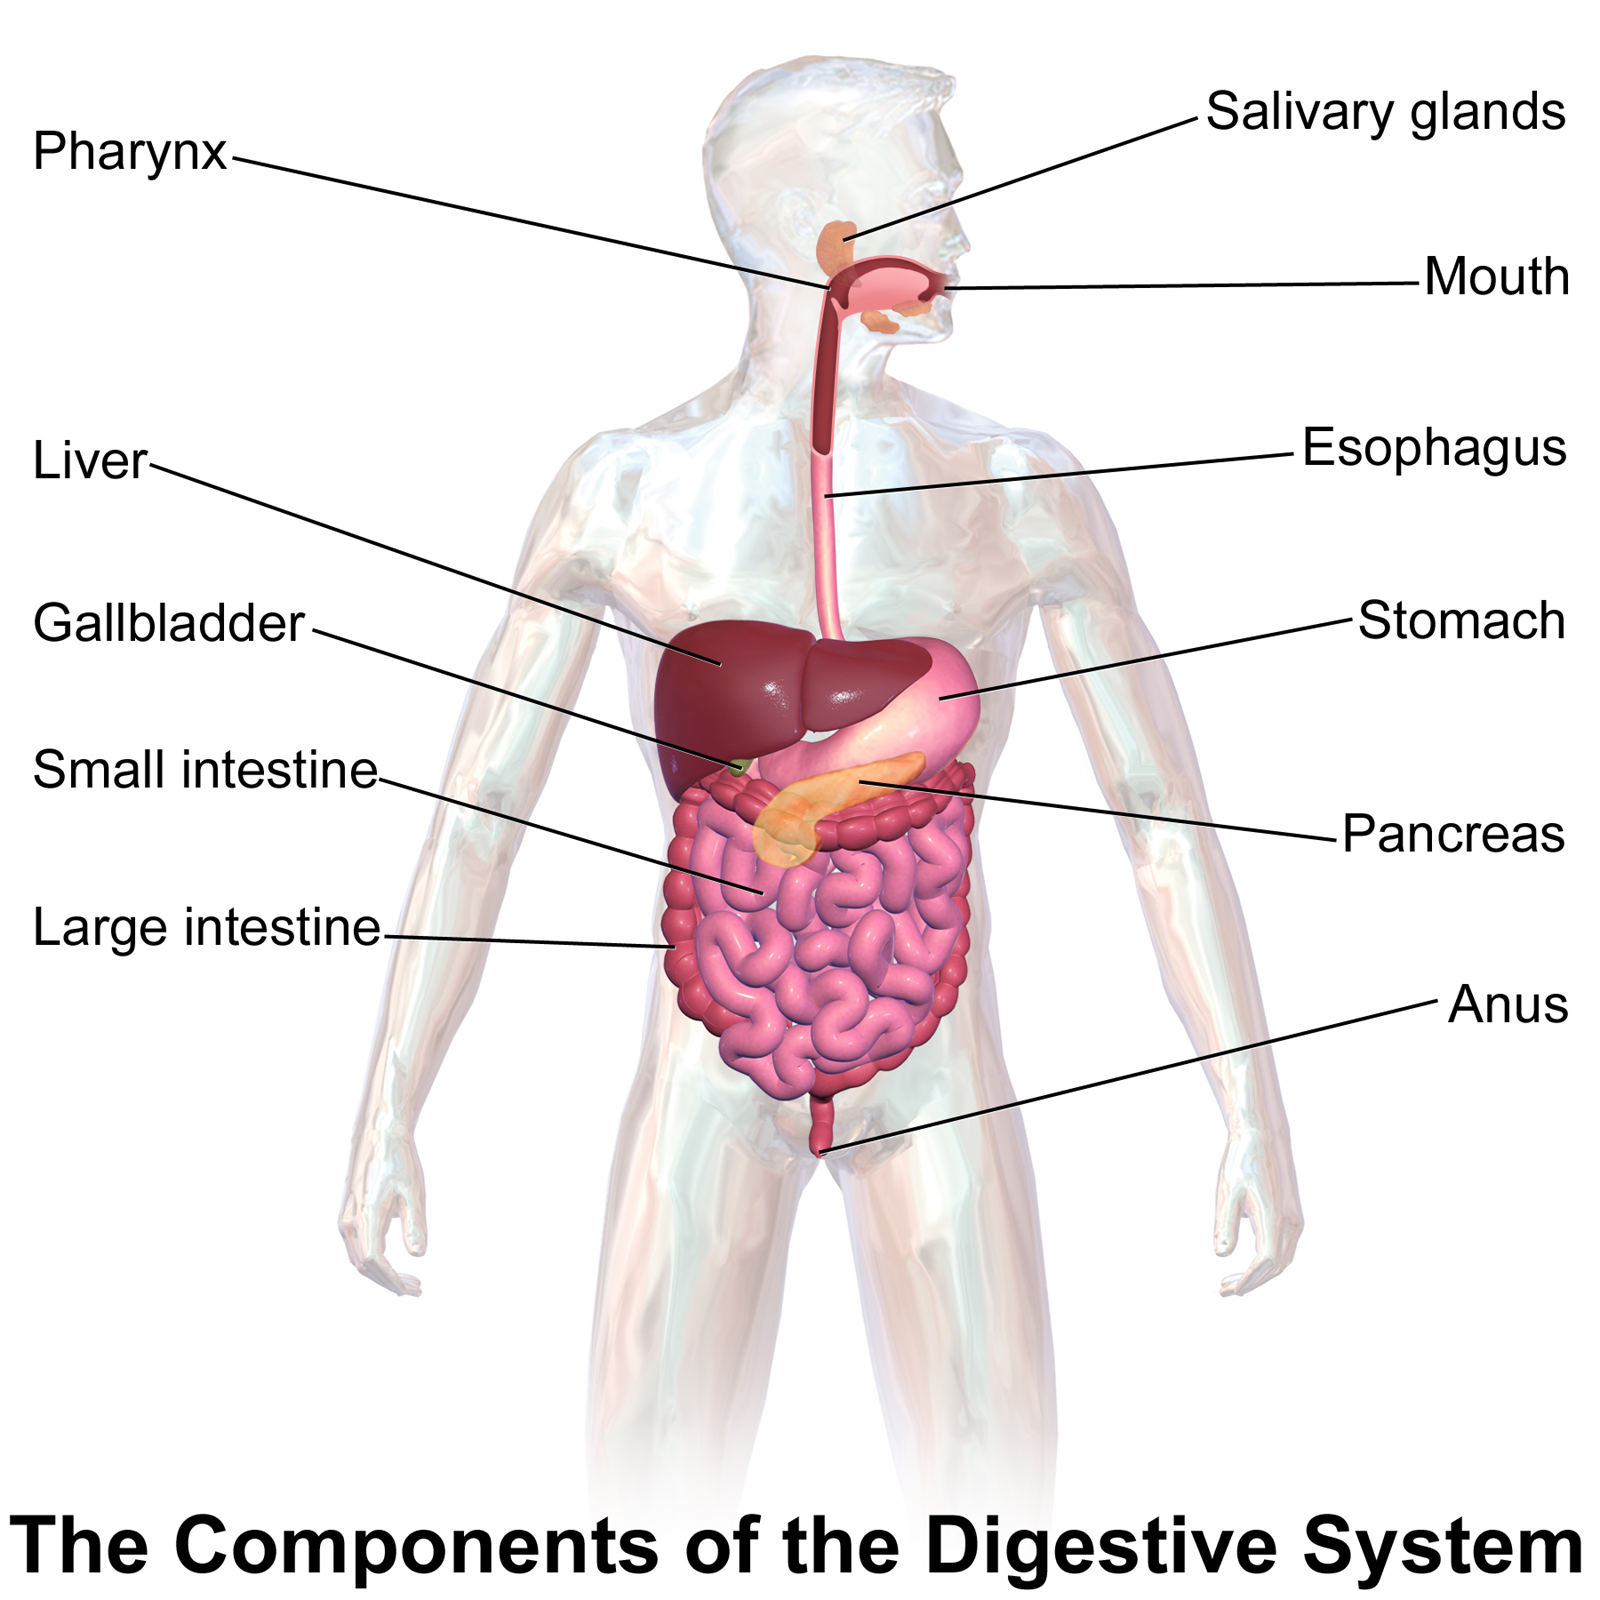
Practice question
Use the printed organ labels in this medical illustration to describe the route food follows from the mouth through the pharynx and oesophagus, stomach, small intestine and large intestine to the anus. Which organ makes bile and which stores it? This broad view does not individually label the duodenum, ileum, colon or rectum; compare it with the full digestive-system schematic for practice with those detailed labels.
Medical-illustration recognition only. Blausen medical illustration, not a photograph, patient image or clinical image. The printed labels are part of the source artwork and remain visible; this is not an unlabelled recall exercise. Duodenum, ileum, colon and rectum are not individually labelled in this illustration.
Illustration: Blausen 0316: Digestive System · BruceBlaus and Blausen.com staff (2014)3D medical illustration; original artwork includes printed organ labels.Show labelled key: Answer key for digestive-system-illustration
Digestive system: Blausen medical illustration
Illustration key
The labelled route is mouth → pharynx → oesophagus → stomach → small intestine → large intestine → anus (the rectum lies before the anus but is not individually labelled here). The liver makes bile; the gallbladder stores and concentrates it. Use the full digestive-system schematic to identify the duodenum and ileum within the small intestine and the colon and rectum within the large intestine.
Blausen medical illustration, not a photograph, patient image or clinical image. The printed labels are part of the source artwork and remain visible; this is not an unlabelled recall exercise. Duodenum, ileum, colon and rectum are not individually labelled in this illustration.
Illustration: Blausen 0316: Digestive System · BruceBlaus and Blausen.com staff (2014)3D medical illustration; original artwork includes printed organ labels.Human digestive systemSimplified schematic; not to scale. - A
- B
- C
- D
- E
- F
- G
- H
- I
- J
- K
- L
- M
Show labelled key: Answer key for digestive-system
Human digestive systemSimplified schematic; not to scale. - AMouth
- BOesophagus
- CLiver
- DGall bladder
- EStomach
- FPancreas
- GDuodenum
- HIleum
- IColon
- JRectum
- KAnus
- LSalivary glands
- MBile duct
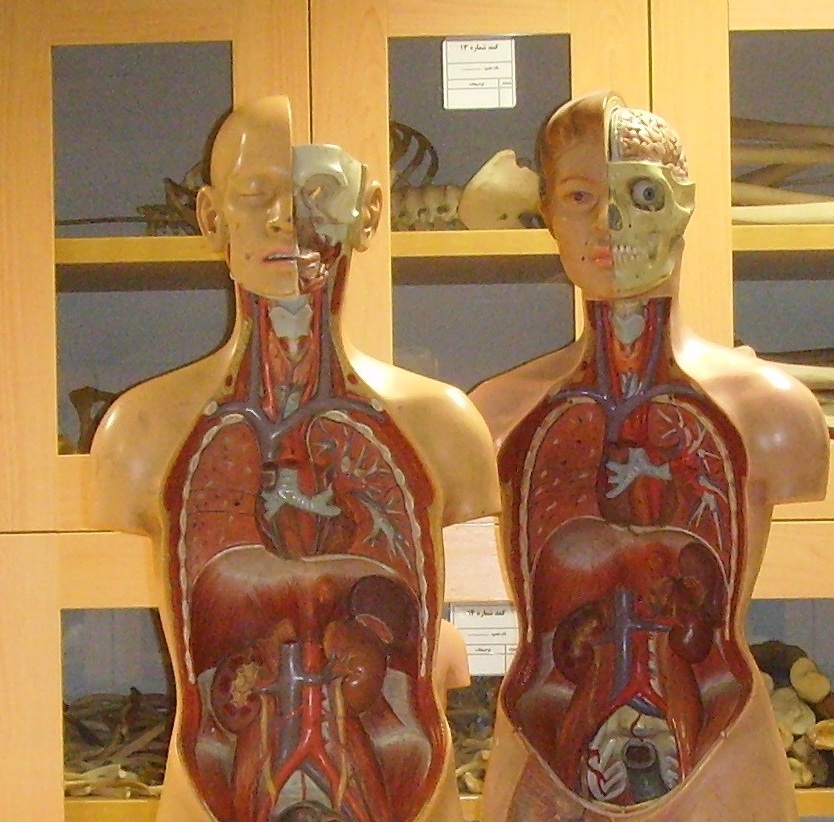
Practice question
What can this photograph reliably identify about the image itself? Why is it not sufficient for identifying specific digestive organs?
Photograph / micrograph recognition only. Not a patient photograph, clinical specimen, or generated illustration. This photograph does not reliably support identifying the pancreas, gallbladder, duodenum, or ileum. Use the paired digestive-system medical illustration for the broad organs and the full schematic for detailed subdivisions.
Photo: Anatomical Moulages (Torso) · RealmasteryPhotograph of physical anatomical torso models in a medical-school moulage room.Show labelled key: Answer key for digestive-model-photo
Partial torso-model photograph
Photo key
It is a photograph of physical anatomical torso teaching models with cutaway views. The source notes that abdominal organs are represented, but this mixed-system frame does not individually label them or reliably support naming specific digestive organs. It remains a partial resource, not a digestive-organ recognition figure.
Not a patient photograph, clinical specimen, or generated illustration. This photograph does not reliably support identifying the pancreas, gallbladder, duodenum, or ileum. Use the paired digestive-system medical illustration for the broad organs and the full schematic for detailed subdivisions.
Photo: Anatomical Moulages (Torso) · RealmasteryPhotograph of physical anatomical torso models in a medical-school moulage room.Sourced labelled Blausen 3D digestive-system image paired with the full alimentary schematic and key; finer divisions are practised on the schematic. Torso-model photo is optional contrast. - Course content
Scope: Course content · Subject-content route: any of Core, Extended (Core and Supplement) · §3 Topic 7 §7.3 Core 3 — actual-image identification of incisors, canines, premolars and molars, distinct from schematic diagrams.
Open revision guidance
What to know
- Inspect both physical jaw models: incisors are the front teeth, pointed canines sit at the corners, premolars lie behind the canines, and the broad, multi-cusped molars are farthest back. The upper and lower occlusal views provide usable actual-image recognition practice for all four classes by crown shape and position.
What to do in an assessment
- In each unlabelled occlusal photograph, trace the arch from the front toward the back and identify incisors, canines, premolars and molars using both crown shape and position. Reveal the photo key after attempting each view.
In plain language
The upper and lower jaw-model photos clearly support recognition of all four tooth classes by shape and position.
Self-check
Starting at the front of either jaw model, what is the order of the four tooth classes, and which features help distinguish them?
Show the answer
Incisors, canines, premolars, then molars. Their front-to-back positions and crown forms distinguish the classes: incisors have cutting edges, canines are pointed, premolars sit behind canines, and broad multi-cusped molars are farthest back.
View diagrams
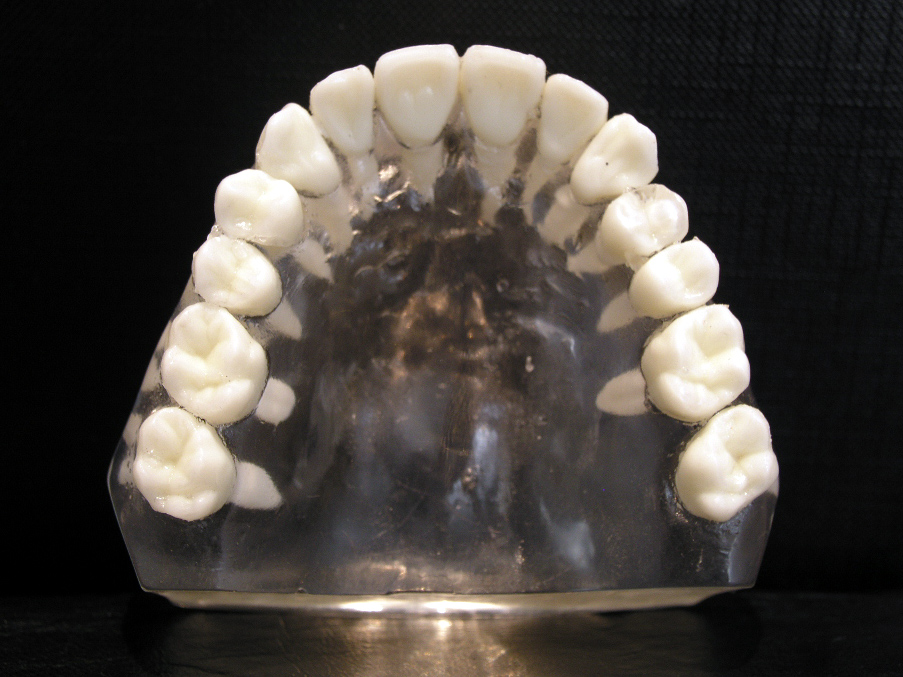
Companion photograph
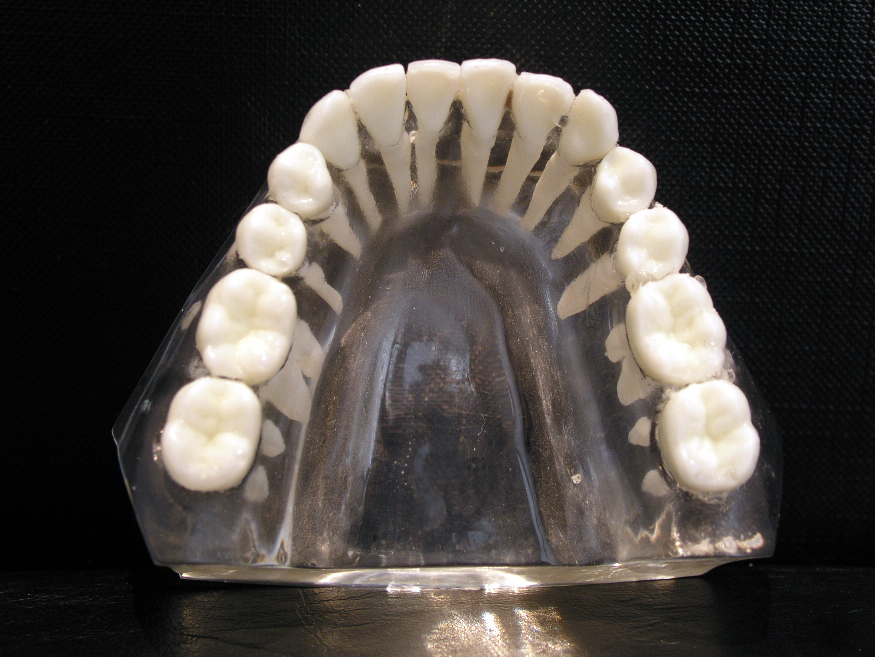
Practice question
Using the crown shapes and front-to-back positions in the upper and lower jaw models, identify the four tooth classes and describe their order around the arch.
Photograph / micrograph recognition only. These are physical models, not specimens or clinical images. Tooth-class recognition is based on visible crown form and position. No scale bar is shown.
Photo: Upper jaw · Håkan Svensson (Xauxa)Top/occlusal photograph of a physical upper-jaw teaching model.Photo: Lower jaw · Håkan Svensson (Xauxa)Top/occlusal photograph of a physical lower-jaw teaching model.Show labelled key: Answer key for dentition-model-photo
Upper and lower jaw occlusal teaching models
Lower jaw
Photo key
The front teeth are incisors; canines sit just behind them at the corners; premolars lie behind the canines; molars are farthest back. Both images are occlusal (top) views of physical teaching models, and the class names are not printed on the teeth.
These are physical models, not specimens or clinical images. Tooth-class recognition is based on visible crown form and position. No scale bar is shown.
Photo: Upper jaw · Håkan Svensson (Xauxa)Top/occlusal photograph of a physical upper-jaw teaching model.Photo: Lower jaw · Håkan Svensson (Xauxa)Top/occlusal photograph of a physical lower-jaw teaching model.Upper- and lower-jaw occlusal model photos: practice all four tooth classes using visible crown shape and front-to-back position. - Course content
Scope: Course content · Subject-content route: any of Core, Extended (Core and Supplement) · §3 Topic 2 §2.1 Core 3 — actual plant, animal and bacterial cell images, in addition to diagram identification.
Open revision guidance
What to know
- The actual-image set complements the schematic identification practice. Onion and Elodea light micrographs show cell walls and nuclei (onion), and walls, chloroplasts and broad vacuole-like spaces (Elodea); the chloroplast TEM shows the organelle outline and internal membrane stacks, not a whole cell. The cheek micrograph supports nucleus, cytoplasm and a visible boundary. The animal TEM shows part of a mammalian cell with nucleus, rough endoplasmic reticulum and mitochondria; it does not show a whole cell or establish species or health. The E. coli SEM shows external rods and its 2.00 µm scale only. The bacterial TEM shows cell outlines and cytoplasm in a different species, but its electron-light/dense particles are not identified as DNA, plasmids, ribosomes or other specific structures. These are explicit limits on individual images: use only source-supported labels, and do not expect every photograph to show every structure.
What to do in an assessment
- Use each actual image in unlabelled practice mode, then reveal its key and compare with the schematic gallery. The paired image and schematic practice covers Core 3 recognition in actual images and diagrams. Distinguish visible structures from source/key limits; do not infer DNA, plasmids or ribosomes from the bacterial TEM arrows, or infer species/health from the animal TEM.
In plain language
Practice identifying cell structures in both real images and diagrams, while using each image only for features it actually resolves.
Self-check
How should you use the actual cell micrographs/TEMs alongside the schematic figures?
Show the answer
Practice recognition in both forms: use diagrams for schematic structure identification and identify only the structures supported by each real image. The chloroplast TEM is an organelle detail, the animal TEM shows only part of a cell, E. coli SEM shows external rods, and the bacterial TEM particles are not identified as DNA, plasmids or ribosomes. These limits prevent over-labelling; they do not require every structure to appear in every photo.
View diagrams
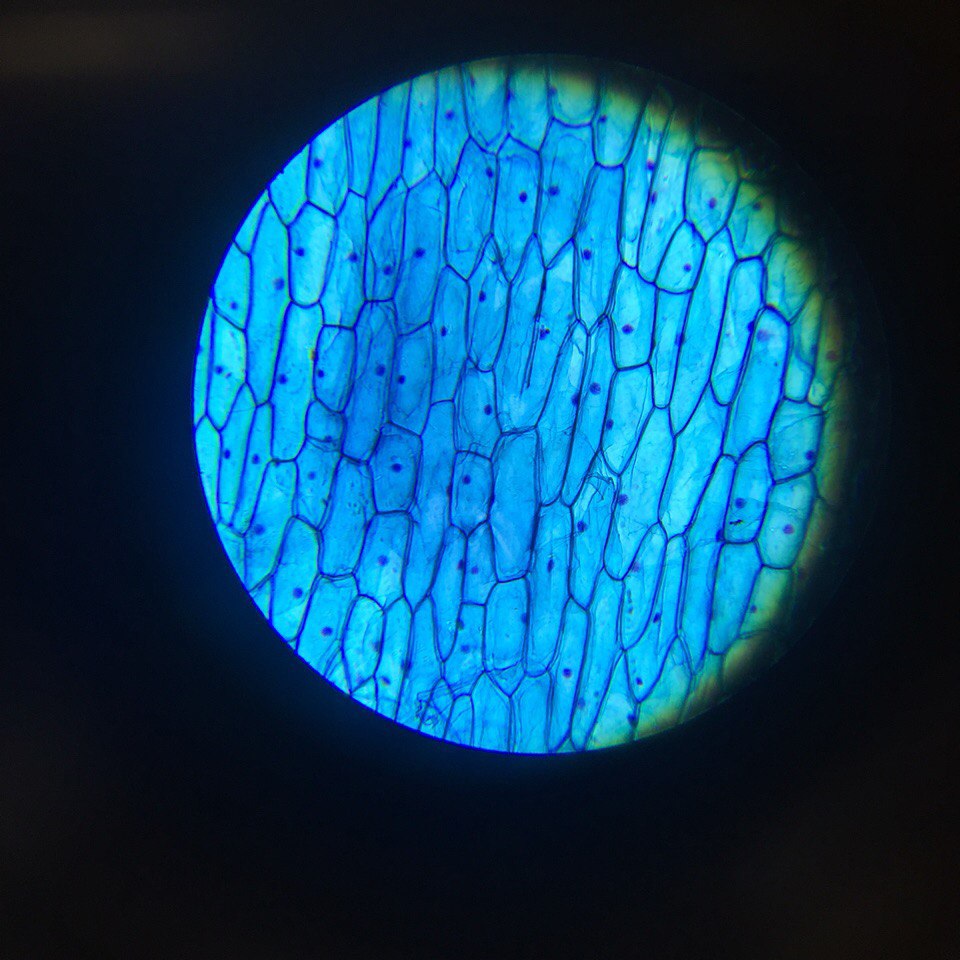
Companion photograph
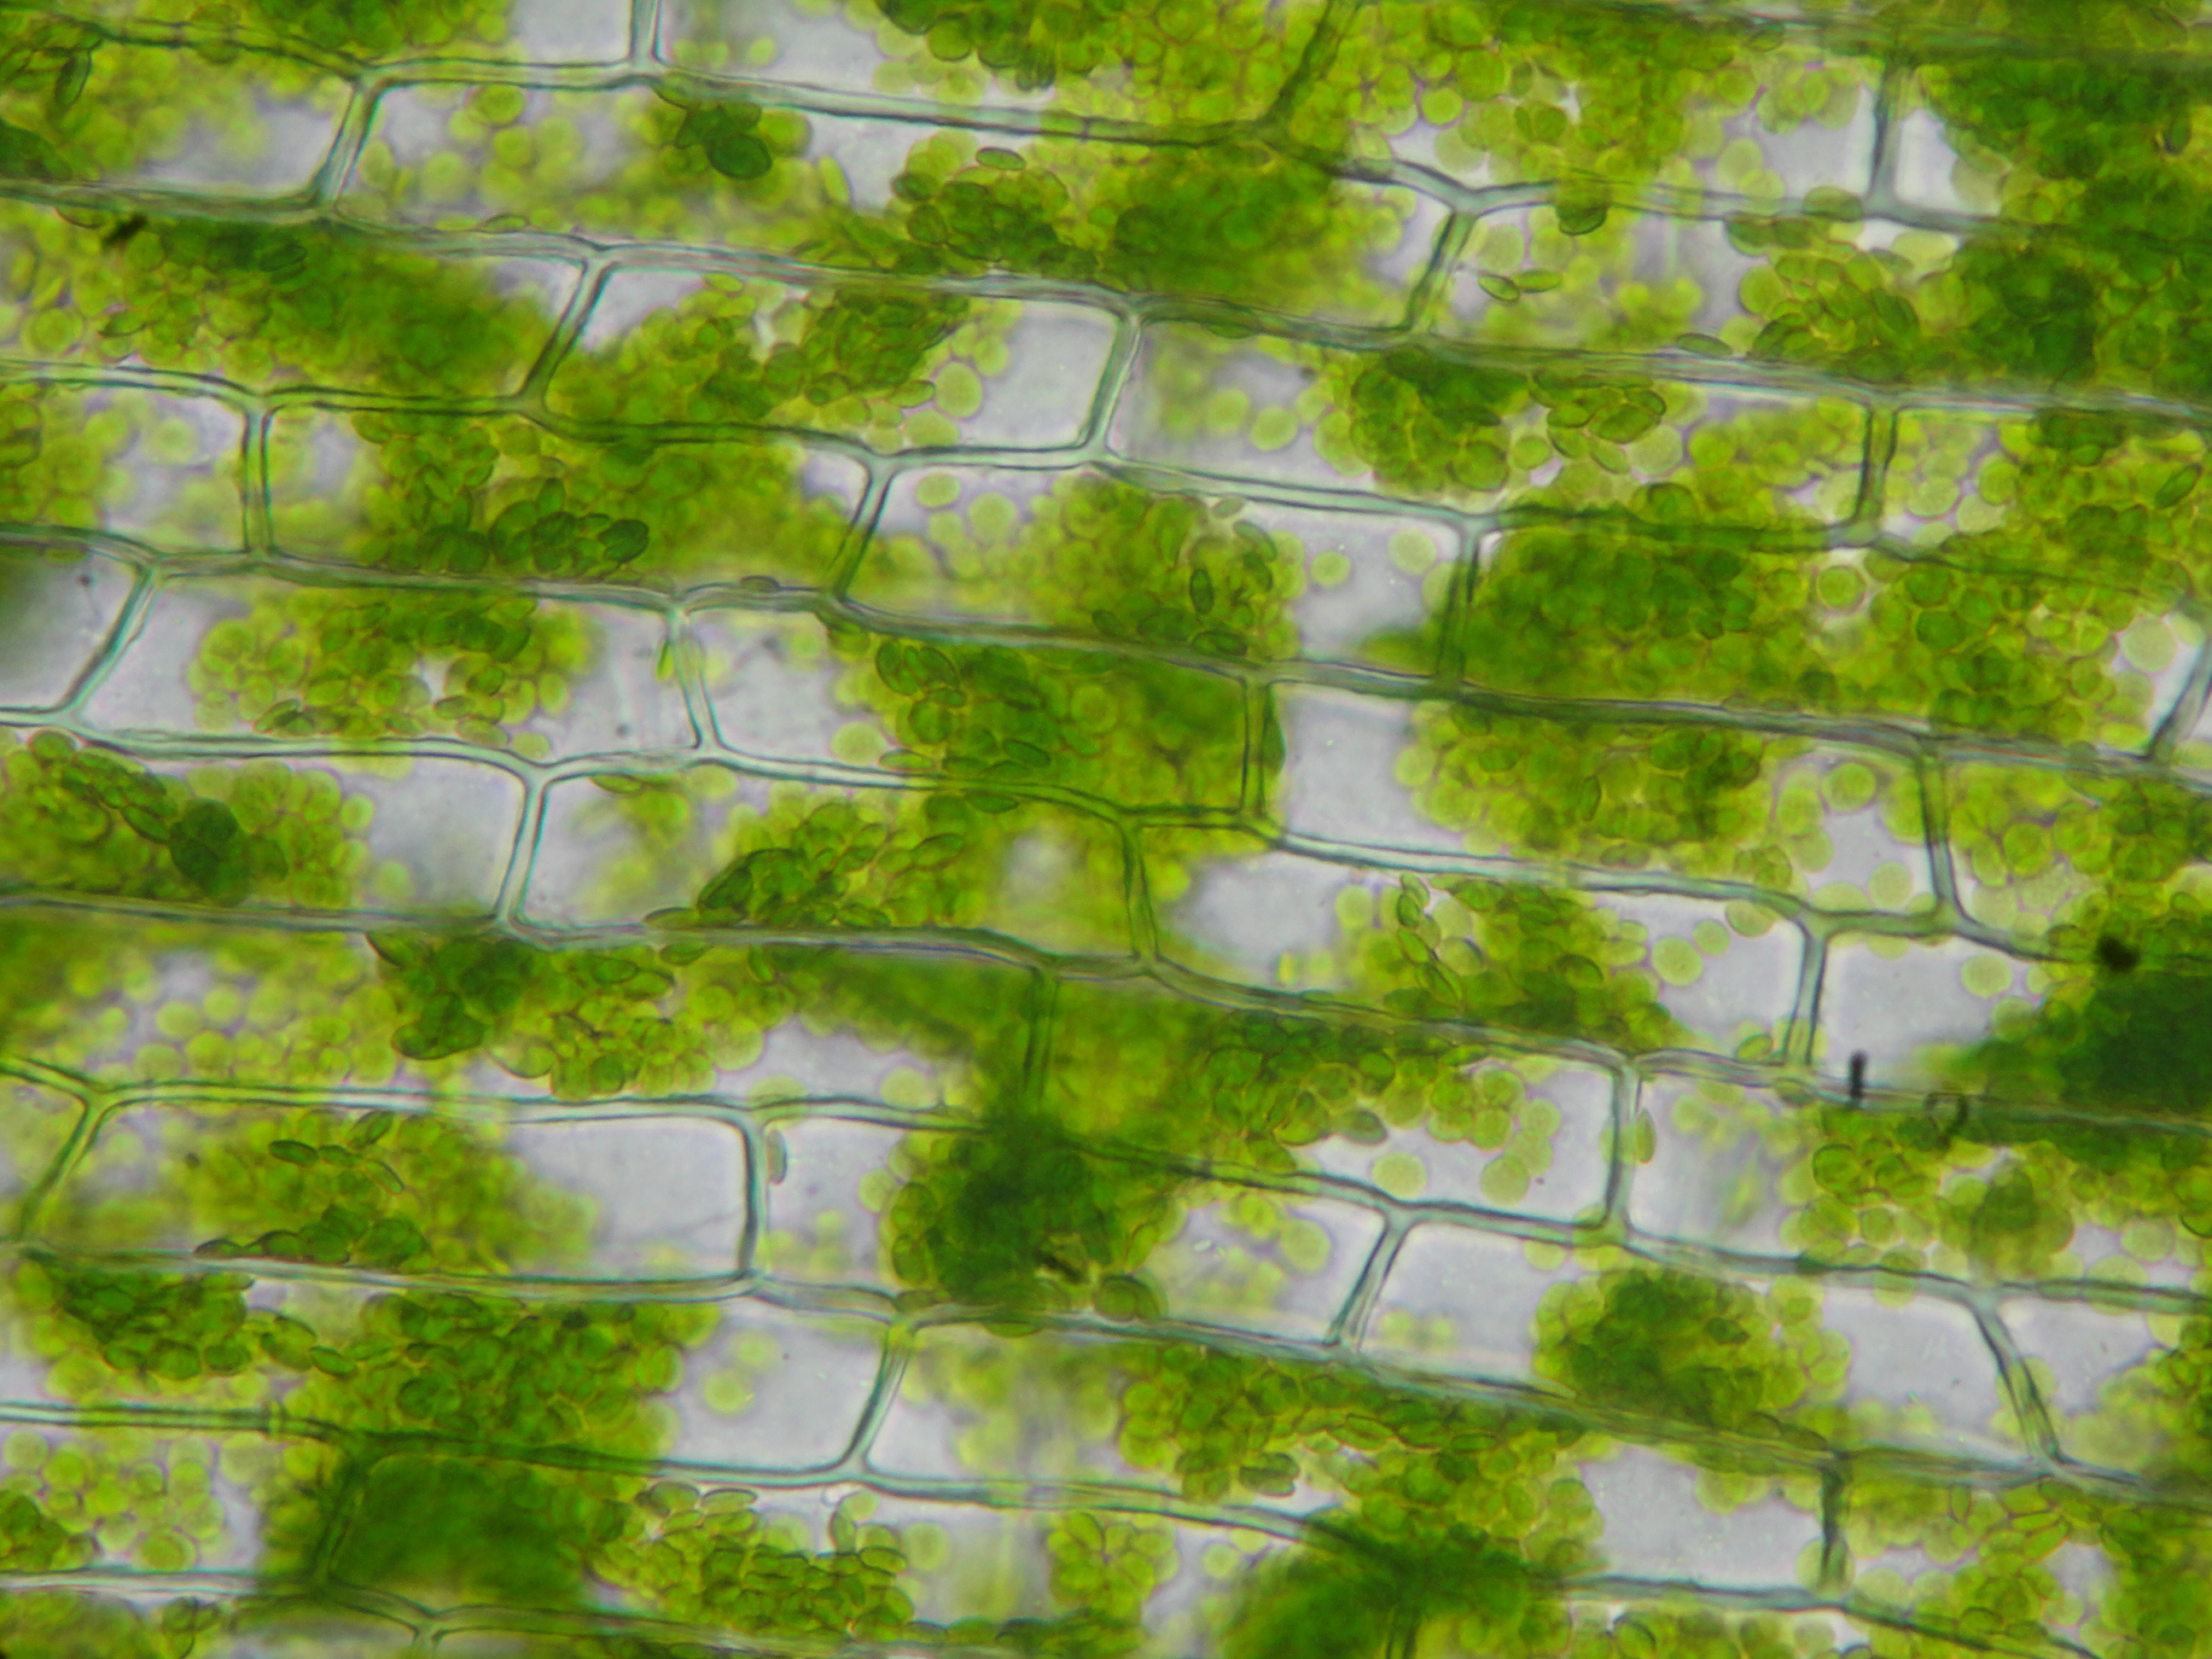
Practice question
Compare the two plant-cell micrographs. In the onion epidermis, what are the clear outer boundaries and dark spots? In the Elodea leaf cells, what are the many green bodies, and what do the broad clear central regions resemble?
Photograph / micrograph recognition only. Neither image separately resolves the plasma membrane from the cell wall. Onion cytoplasm and vacuole are not distinguishable here; the Elodea cytoplasm and any nucleus are not clearly resolved. Do not claim the Elodea photo shows a nucleus.
Photo: Onion skin cells under a microscope · Katekor1Stained Allium cepa (onion) epidermis light micrograph.Photo: Chloroplasts - Microscopic view of Elodea canadensis · Juan Carlos Fonseca MataElodea canadensis leaf cells; source identifies chloroplasts.Show labelled key: Answer key for plant-cell-micrographs
Plant cells: onion epidermis and Elodea leaf
Chloroplasts - Microscopic view of Elodea canadensis
Photo key
The onion epidermis shows cell walls and nuclei. The Elodea leaf micrograph shows cell walls, many chloroplasts, and broad clear central regions consistent with vacuoles. The onion bulb epidermis does not normally contain chloroplasts. A nucleus is not clearly resolved in the Elodea image.
Neither image separately resolves the plasma membrane from the cell wall. Onion cytoplasm and vacuole are not distinguishable here; the Elodea cytoplasm and any nucleus are not clearly resolved. Do not claim the Elodea photo shows a nucleus.
Photo: Onion skin cells under a microscope · Katekor1Stained Allium cepa (onion) epidermis light micrograph.Photo: Chloroplasts - Microscopic view of Elodea canadensis · Juan Carlos Fonseca MataElodea canadensis leaf cells; source identifies chloroplasts.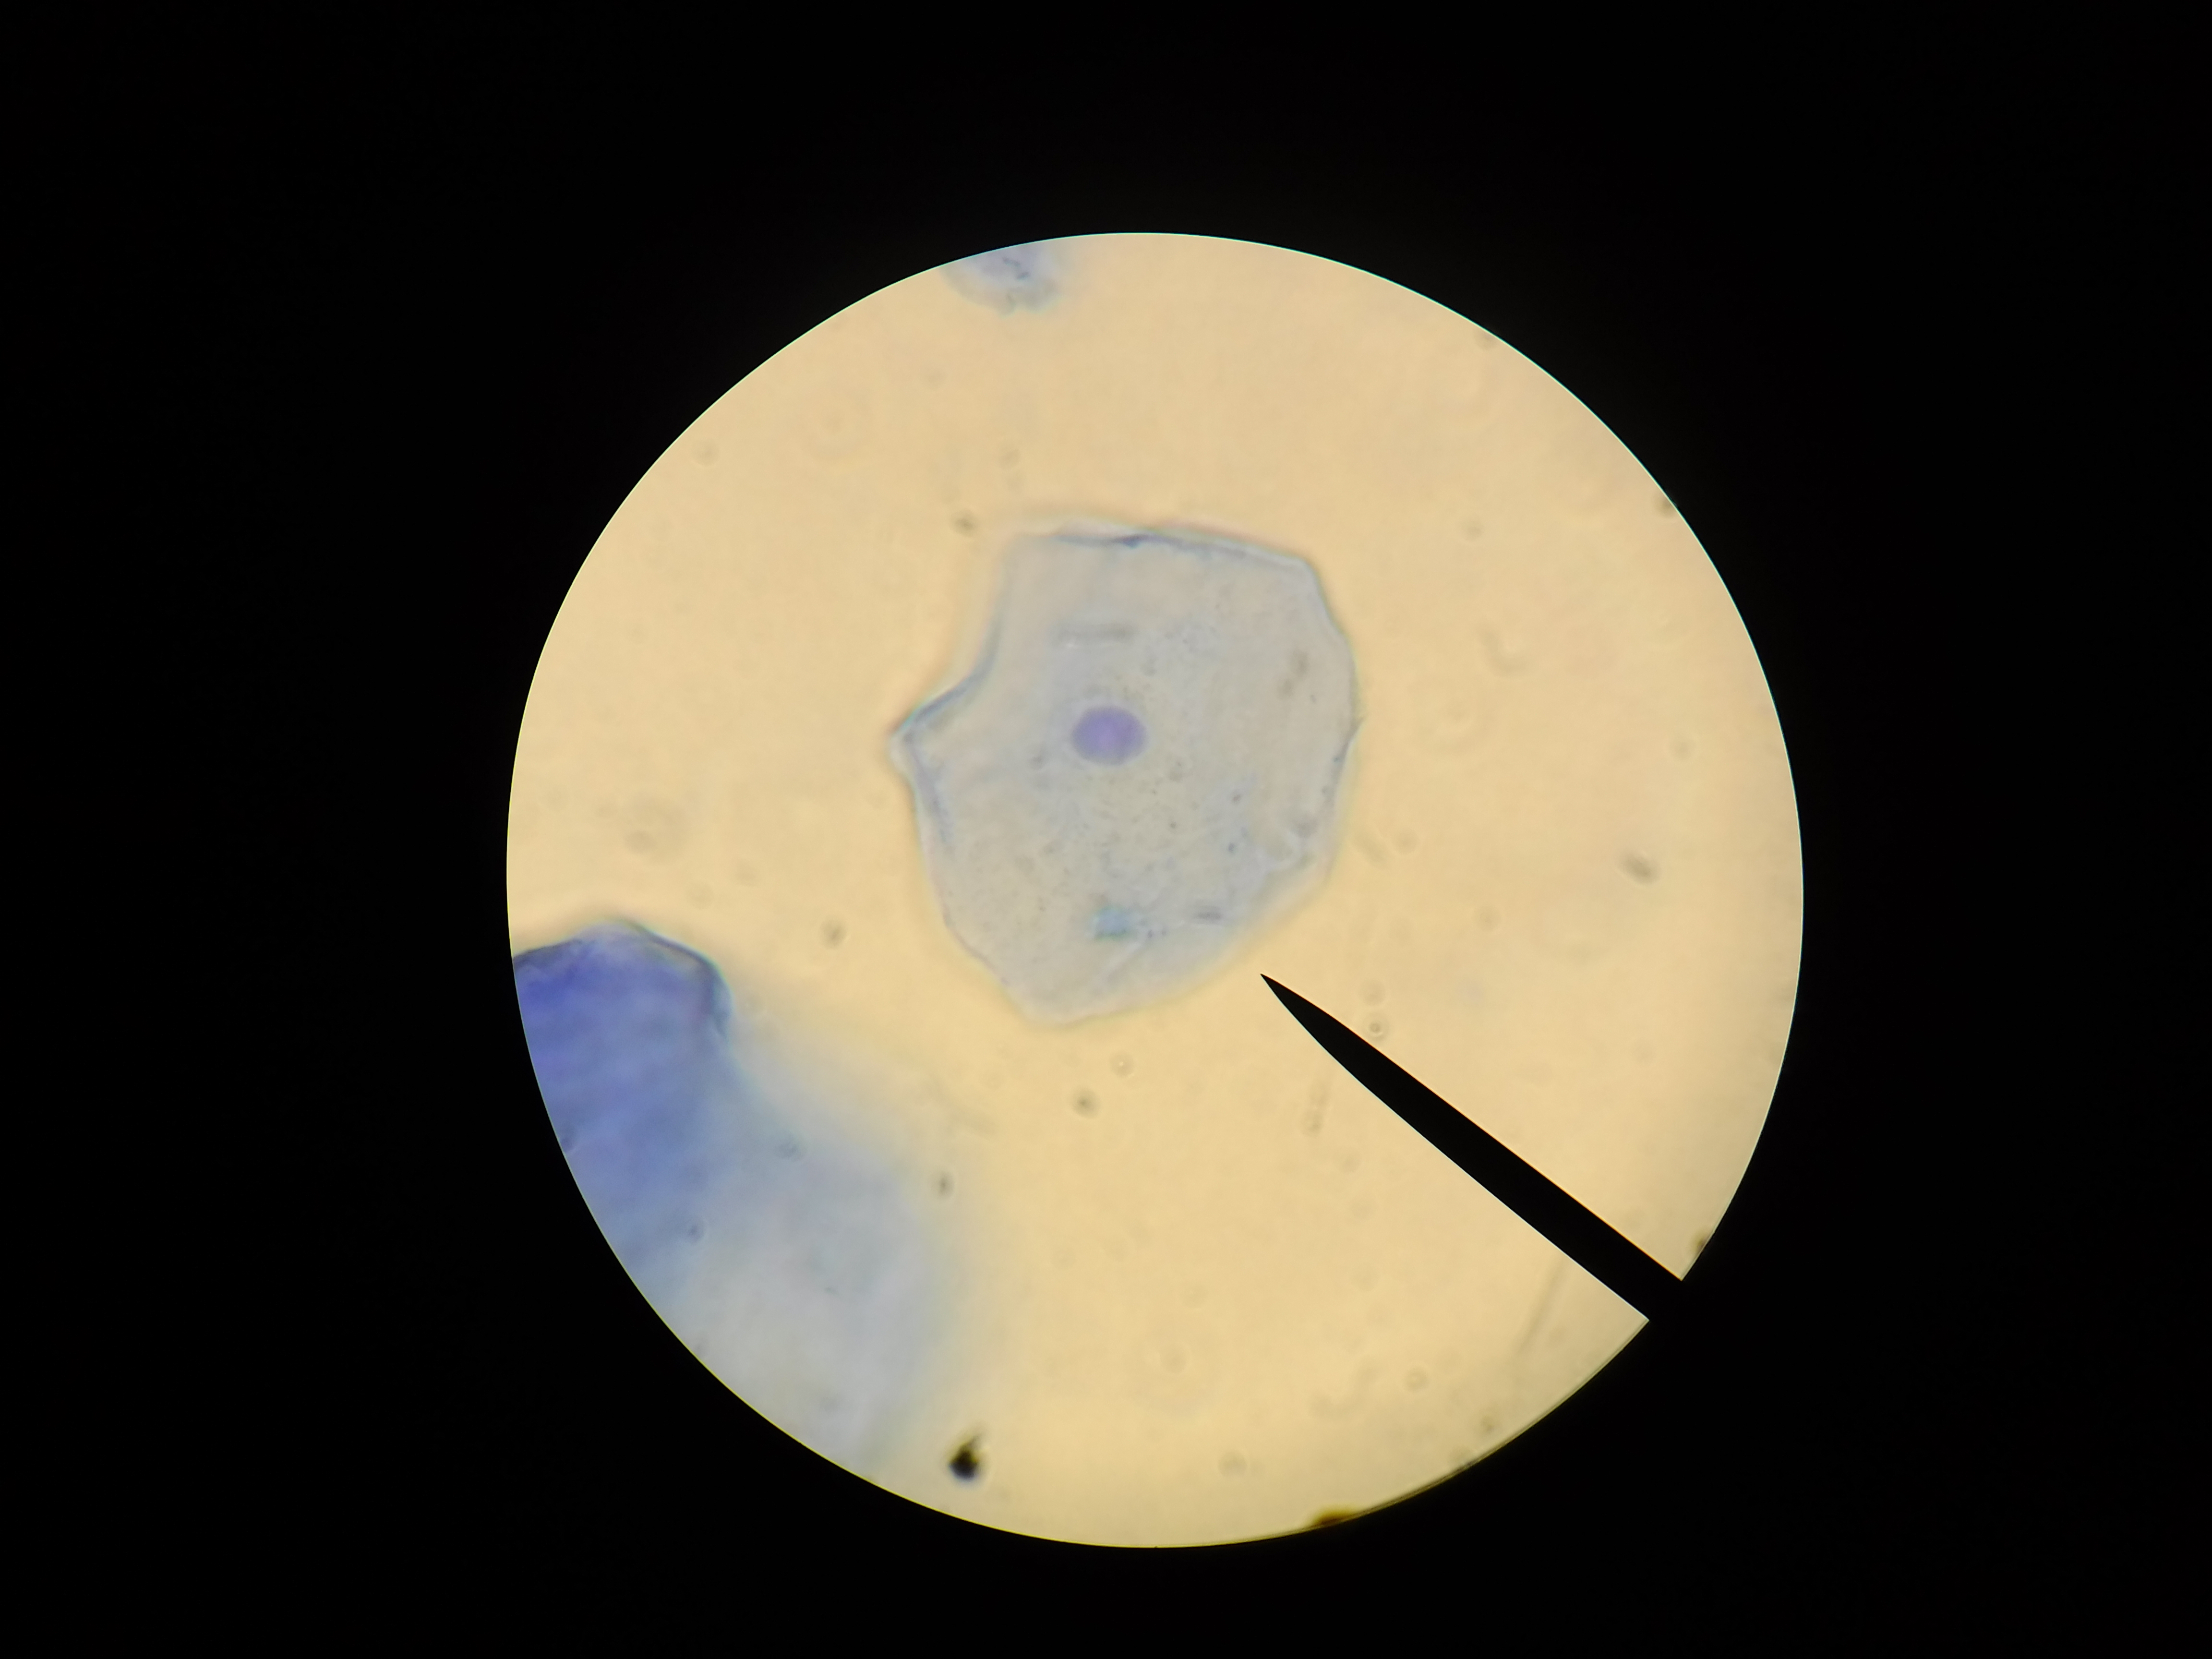
Practice question
In the clearest central cheek cell, identify the purple-stained structure, the pale interior, and the visible outer cell boundary.
Photograph / micrograph recognition only. This is a real microscope photograph of a human cheek-cell sample, not a model. The cell surface membrane cannot be distinguished separately from the outer boundary. The image has no scale bar and the source gives no stain information.
Photo: Human cheek cells from science class · KyrebSource describes a microscope photograph of the photographer’s own inner-cheek sample.Show labelled key: Answer key for animal-cell-micrograph
Human cheek-cell micrograph
Photo key
The purple-stained structure is the nucleus; the pale interior is cytoplasm. The cell boundary is visible, but the membrane is not separately resolved as a bilayer.
This is a real microscope photograph of a human cheek-cell sample, not a model. The cell surface membrane cannot be distinguished separately from the outer boundary. The image has no scale bar and the source gives no stain information.
Photo: Human cheek cells from science class · KyrebSource describes a microscope photograph of the photographer’s own inner-cheek sample.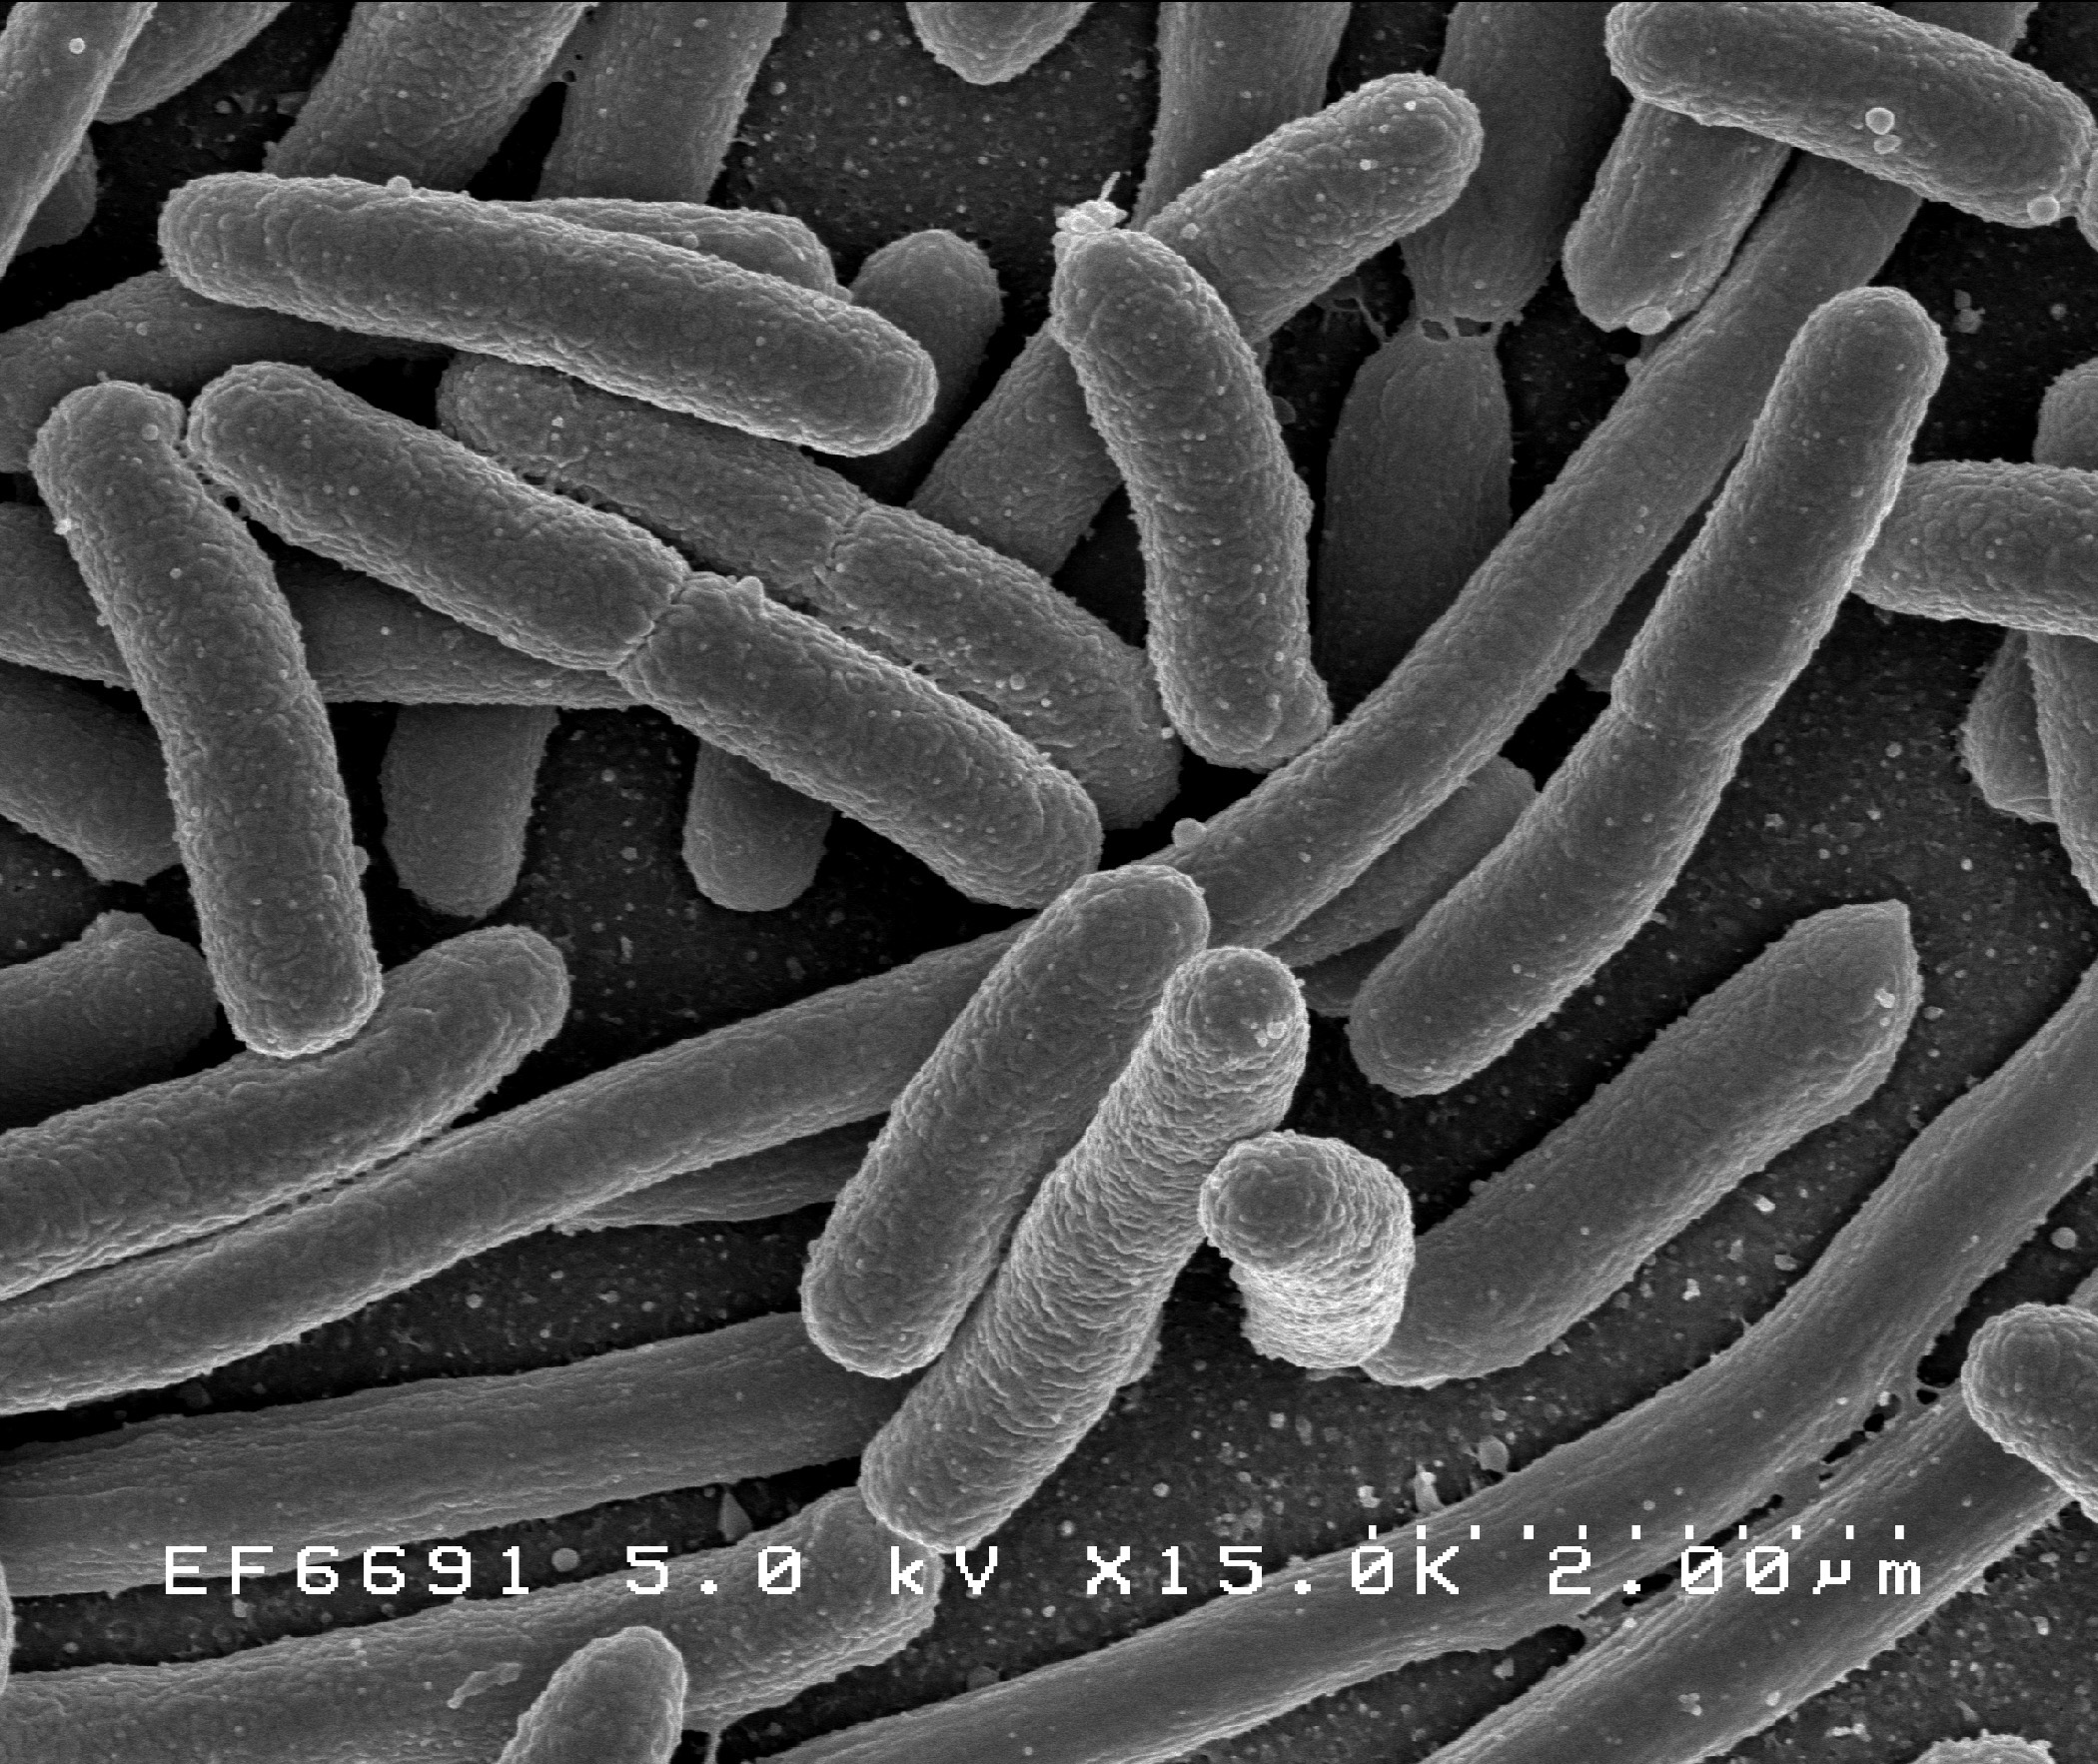
Practice question
What overall shape do the visible bacteria have? What does the scale annotation help you estimate?
Photograph / micrograph recognition only. The organism is identified by the source as cultured E. coli. This SEM does not reveal internal structures. Use the bacterial-cell schematic for cell contents; do not label DNA or plasmids on this photograph.
Photo: E. coli Bacteria (7316101966) · NIAIDScanning electron micrograph; the original image includes a 2.00 µm scale annotation.Show labelled key: Answer key for bacterial-cell-micrograph
E. coli scanning electron micrograph
Photo key
The image shows rod-shaped Escherichia coli. The printed scale annotation represents 2.00 µm. This scanning electron micrograph shows the outer form only; it does not show cytoplasm, DNA, a nucleoid, or plasmids.
The organism is identified by the source as cultured E. coli. This SEM does not reveal internal structures. Use the bacterial-cell schematic for cell contents; do not label DNA or plasmids on this photograph.
Photo: E. coli Bacteria (7316101966) · NIAIDScanning electron micrograph; the original image includes a 2.00 µm scale annotation.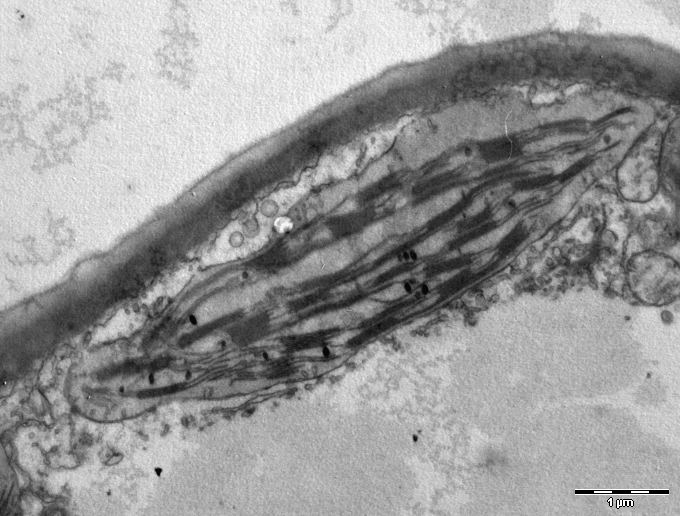
Practice question
In this TEM detail, identify the organelle outline and the repeated internal membrane stacks. What scale is shown?
Photograph / micrograph recognition only. The source names Anemone only as sp.; no exact species is identified. This image does not show a whole cell, cell wall, nucleus, or broad cytoplasm. Individual membrane bilayers are not resolved.
Photo: Chloroplast in leaf of Anemone sp TEM 12000x · And3k and Caper437TEM source page gives 12,000× magnification and a 1 µm scale bar.Show labelled key: Answer key for plant-chloroplast-tem
Chloroplast TEM
Photo key
This is a chloroplast from an Anemone sp. leaf cell. The organelle outline and internal membrane stacks are visible; the scale bar is 1 µm. The image shows an organelle detail, not a whole cell.
The source names Anemone only as sp.; no exact species is identified. This image does not show a whole cell, cell wall, nucleus, or broad cytoplasm. Individual membrane bilayers are not resolved.
Photo: Chloroplast in leaf of Anemone sp TEM 12000x · And3k and Caper437TEM source page gives 12,000× magnification and a 1 µm scale bar.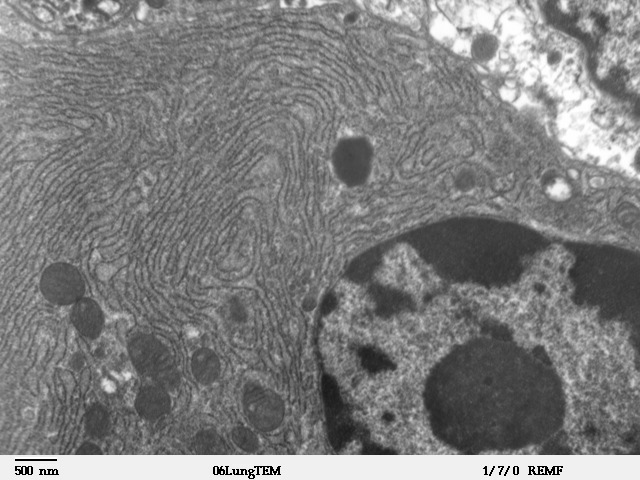
Practice question
Use relative position and appearance in this thin section to identify the visible part of the nucleus, rough endoplasmic reticulum, and mitochondria.
Photograph / micrograph recognition only. The source does not identify the mammal or establish donor health status. Only part of the cell is shown; the complete cell outline and surface membrane are not present.
Photo: Clara cell lung - TEM · Louisa Howard; Dartmouth Electron Microscope FacilityMammalian lung TEM collection.Source provenance: Dartmouth Electron Microscope FacilityShow labelled key: Answer key for animal-cell-tem
Mammalian bronchiolar club-cell TEM
Photo key
The source identifies part of the nucleus, rough endoplasmic reticulum, and mitochondria in the cytoplasm of a mammalian bronchiolar club (Clara) cell. A 500 nm scale bar is visible; the full cell boundary is outside this frame.
The source does not identify the mammal or establish donor health status. Only part of the cell is shown; the complete cell outline and surface membrane are not present.
Photo: Clara cell lung - TEM · Louisa Howard; Dartmouth Electron Microscope FacilityMammalian lung TEM collection.Source provenance: Dartmouth Electron Microscope Facility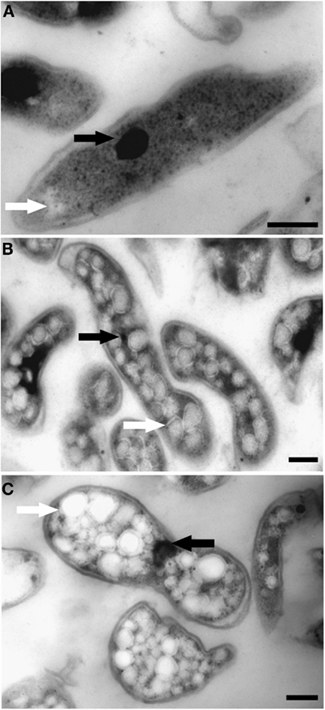
Practice question
Compare the cell outlines and internal contrast across panels A-C. What can be said about the arrow-marked regions without assigning them an organelle identity?
Photograph / micrograph recognition only. This is a different bacterium from E. coli. Do not use its arrows to claim that DNA, plasmids, or ribosomes are resolved. The source panels show cells under differing growth conditions.
Photo: Fmicb-03-00345-g005 · Ahmad F. Khadem, Muriel C. F. van Teeseling, Laura van Niftrik, Mike S. M. Jetten, Huub J. M. Op den Camp, and Arjan PolThree TEM panels with 200 nm scale bars.Show labelled key: Answer key for bacterial-cell-tem
Methylacidiphilum fumariolicum TEM panels
Photo key
These are chemically fixed, thin-sectioned Methylacidiphilum fumariolicum cells from different growth phases. Cell outlines and cytoplasm are visible; the arrows mark electron-light and electron-dense particles. The source does not identify these particles as DNA, plasmids, ribosomes, or other specific structures.
This is a different bacterium from E. coli. Do not use its arrows to claim that DNA, plasmids, or ribosomes are resolved. The source panels show cells under differing growth conditions.
Photo: Fmicb-03-00345-g005 · Ahmad F. Khadem, Muriel C. F. van Teeseling, Laura van Niftrik, Mike S. M. Jetten, Huub J. M. Op den Camp, and Arjan PolThree TEM panels with 200 nm scale bars.Actual micrograph and TEM practice: identify only features named or resolved in each source image; respect the organelle/partial-cell views and do not assign identities to unlabelled bacterial particles.
Verified qualification
Cambridge IGCSE (9–1) Biology (0970)
Exam years · 2027Specification version · Version 3
Course details
Assessment The assessment includes Paper 1, Paper 2, Paper 3, Paper 4, Paper 5 and Paper 6; see the official specification for the full structure.
Tick a point after revising it. Progress is saved on this device and does not measure mastery.
Reviewed course guidance
Revision points, with the explanation beside them
Open a point to read what to know, how to use it in an assessment, a plain-language explanation and a self-check. Answers stay hidden until you choose to reveal them.
Options and source
Subject-content route
- Core
- Extended (Core and Supplement)
§3, p. 12 and §4, p. 49: Core candidates study Core; Extended candidates study Core and Supplement.
Practical examination
- Paper 5: Practical Test
- Paper 6: Alternative to Practical
Progress could not be saved in this browser. Your ticks will remain for this page view only.
Topic group
Topic 1 Core
- Course content
Scope: Course content · Subject-content route: any of Core, Extended (Core and Supplement) · §3 Topic 1: §1.1 Core 1(a)–(g); §1.2 Core 1–4; §1.3 Core 1–3
Open revision guidance
What to know
- For §1.1 Core 1(a)–(g), distinguish the seven life processes: movement changes an organism’s position/place; respiration is cellular chemical reactions that break down nutrient molecules and release energy for metabolism; sensitivity detects and responds to internal or external change; growth is permanent increase in size and dry mass; reproduction makes more organisms of the same kind; excretion removes metabolic wastes and excess substances; nutrition takes in materials for energy, growth and development. Breathing is ventilation, not cellular respiration; excretion is not egestion.
- For §1.2 Core 1–3, shared features provide the basis for grouping; a species is organisms that can reproduce to produce fertile offspring. A binomial scientific name contains genus followed by species; capitalize the genus, use lower-case species, and italicise (or underline separately by hand). For Core 4, a dichotomous key offers paired alternatives: select a single identifiable contrasting feature, follow the indicated step and continue until the organism is classified.
- For §1.3 Core 1–3, use kingdom-level features: plants are multicellular eukaryotes with cellulose walls and usually chloroplasts, making food by photosynthesis; animals are multicellular eukaryotes without cell walls/chloroplasts and obtain food by feeding. Vertebrates have a backbone; the named groups are mammals, birds, reptiles, amphibians and fish. Arthropods share a segmented body, jointed legs and an exoskeleton; myriapods have many segments/legs, insects three pairs of legs, arachnids four pairs and crustaceans usually two pairs of antennae and many legs. Classify from the stated characters, not habitat.
What to do in an assessment
- Apply a key in order and record the observable feature that justifies each choice; for an unfamiliar specimen, compare several features before assigning its group.
In plain language
The seven life processes describe living activity; observable shared features identify kingdoms, groups and species.
Self-check
An animal has a backbone, feathers and a beak. Which vertebrate group is supported? Explain the evidence and define excretion.
Show the answer
Bird: feathers and a beak are distinguishing features, while a backbone places it among vertebrates. Excretion removes metabolic waste products and substances in excess of requirements.
Topic group
Topic 1 Supplement
- Course content
Scope: Course content · Subject-content route: Extended (Core and Supplement) · §3 Topic 1: §1.2 Supplement 5–7; §1.3 Supplement 4–7
Open revision guidance
What to know
- §1.2 Supplement 5–7: classification systems aim to reflect evolutionary relationships. DNA base sequences are used as classification evidence: organisms with a more recent common ancestor are more closely related and have more similar DNA sequences than organisms that share only a distant ancestor.
- §1.3 Supplement 4: five kingdoms are animal, plant, fungus, prokaryote and protoctist. Animals are multicellular eukaryotes without cell walls/chloroplasts and feed on organic material; plants are multicellular eukaryotes with cellulose cell walls/chloroplasts and photosynthesise; fungi have cell walls and feed saprotrophically (many have hyphae/mycelium; yeast is unicellular); prokaryotes are unicellular without a nucleus and have circular DNA; protoctists are eukaryotes, mostly unicellular, including plant-like algae and animal-like forms.
- §1.3 Supplement 5–6: ferns reproduce by spores and have fronds; flowering plants reproduce with flowers and seeds. Dicotyledons typically have two cotyledons, net-veined leaves and floral parts in fours/fives; monocotyledons typically have one cotyledon, parallel-veined leaves and floral parts in threes. Use those combinations to classify. Supplement 7: viruses have genetic material surrounded by a protein coat; they are acellular.
What to do in an assessment
- When using DNA to compare groups, identify which sequences are more similar before inferring a closer relationship. When classifying a plant, state more than one matching feature and avoid treating typical features as an exception-free definition.
In plain language
The Supplement adds ancestry inferred from DNA, five-kingdom characters, finer plant groups and the simple viral structure.
Self-check
A and B share more DNA bases in the compared sequence than A and C. What is the justified relationship inference? What are the two syllabus-listed parts of a virus?
Show the answer
A and B are more closely related because their sequences are more similar, supporting a more recent common ancestor. The virus has genetic material and a protein coat.
Topic group
Topic 2 Core
- Course content
Scope: Course content · Subject-content route: any of Core, Extended (Core and Supplement) · §3 Topic 2 §2.1 Core 1–2 and 4–7; excludes Core 3 diagram/image identification, which is tracked in separate diagram and image requirements.
Open revision guidance
What to know
- Compare plant and animal cells using only the syllabus list: both have a cell membrane, cytoplasm, nucleus, ribosomes and mitochondria; plant cells also have a cellulose cell wall, chloroplasts in photosynthesising cells, and a large permanent vacuole. Bacterial cells have a cell wall, cell membrane, cytoplasm and ribosomes, with circular DNA and plasmids; the DNA is not enclosed in a nucleus. Functions: membrane controls exchange; cytoplasm is where many reactions occur; nucleus contains genetic material and controls activities; ribosomes make proteins; mitochondria are sites of aerobic respiration; chloroplasts carry out photosynthesis; cell wall supports and strengthens; vacuole contains cell sap and helps maintain turgor; bacterial circular DNA carries essential genes and plasmids carry additional genes.
- Use the named specialisations and functions: ciliated cells move mucus in trachea/bronchi; root hair cells absorb; palisade mesophyll cells photosynthesise; neurones conduct electrical impulses; red blood cells transport oxygen; sperm and egg cells are gametes for reproduction. New cells arise by division of existing cells. A cell is the basic unit; a tissue is similar cells working together; an organ is tissues working together; an organ system is organs working together; an organism is an individual living thing (for example, muscle cell → muscle tissue → heart → circulatory system → person).
What to do in an assessment
- For a cell comparison, name the structure, state which cell types have it and give its function; for levels of organisation, explain how the example at each level contributes to the next.
In plain language
Cells share basic structures, but their differences and specialisations relate to their functions; groups of cells build tissues, organs and organisms.
Self-check
Name two structures found in plant cells but not animal cells, state one function for each, and give the role of a root hair cell.
Show the answer
Cell wall supports and strengthens; chloroplasts carry out photosynthesis (in photosynthesising cells). A root hair cell absorbs water and mineral ions; its syllabus-listed specialised function is absorption.
- Course content
Scope: Course content · Subject-content route: any of Core, Extended (Core and Supplement) · §3 Topic 2, §2.2 Core 1–2
Open revision guidance
What to know
- Use magnification = image size ÷ actual size. Rearrange as image size = magnification × actual size, or actual size = image size ÷ magnification. Put image and actual size in the same units before calculating; magnification has no unit. A larger image does not mean a larger actual specimen if magnifications differ.
What to do in an assessment
- Write the formula, substitute with matching units, show the calculation, and state a length answer in millimetres as required by the Core outcome.
In plain language
Magnification compares the measured image with the specimen’s real size.
Self-check
An image is 24 mm long at ×6 magnification. What is the actual length?
Show the answer
Actual size = 24 mm ÷ 6 = 4 mm.
Topic group
Topic 2 Core visual gap
- Course content
Scope: Course content · Subject-content route: any of Core, Extended (Core and Supplement) · §3 Topic 2 §2.1 Core 3 diagram-identification component; schematic plant, animal and bacterial cell diagrams are covered, with the image-recognition component separated.
Open revision guidance
What to know
- Classify the whole cell before naming structures: plant cells may show a cellulose wall, chloroplasts and a large permanent vacuole; animal cells lack those features; bacteria have no nucleus and show circular DNA/plasmids. Then identify boundaries and internal structures from the exact source diagram: trace each leader line to its endpoint, distinguish membrane from wall, and match each label to one feature. A list or imagined diagram is not evidence of diagram-identification skill. Required practice: unlabelled schematic plant and animal cell diagrams containing the full source-listed structures, and bacterial-cell diagrams containing cell wall, membrane, cytoplasm, ribosomes, circular DNA and plasmid, each with an answer key.
What to do in an assessment
- On a supplied diagram first state the cell class and distinguishing visible evidence; then trace leader lines to endpoints, label one structure at a time and check that the name matches the line rather than a nearby feature. Recheck by comparing labelled and unlabelled schematic diagrams; use the attached gallery practice, then reveal its keyed answer to check every structure and leader line.
In plain language
Classify a cell diagram, then trace and label structures accurately; the source-required real-image recognition is a separate scope.
Self-check
What can schematic practice establish, and what distinct source outcome remains unfulfilled?
Show the answer
The gallery teaches diagram labelling for plant, animal and bacterial cells. The separate requirement to identify those cell types from actual images is still uncovered.
View diagrams
Plant cell · Unlabelled practice · Schematic, simplified and not to scale. Show labelled key: Answer key for plant-cell
Plant cell · Structure key · Schematic, simplified and not to scale. Animal cell · Unlabelled practice · Schematic, simplified and not to scale. Show labelled key: Answer key for animal-cell
Animal cell · Structure key · Schematic, simplified and not to scale. Bacterial cell · Unlabelled practice · Schematic, simplified and not to scale. Show labelled key: Answer key for bacterial-cell
Bacterial cell · Structure key · Schematic, simplified and not to scale. Practise matching plant, animal and bacterial cell structures to the required labels; use the key to check cell boundaries, organelles, DNA and plasmids.
Topic group
Topic 2 Supplement
- Course content
Scope: Course content · Subject-content route: Extended (Core and Supplement) · §3 Topic 2, §2.2 Supplement 3
Open revision guidance
What to know
- One millimetre is 1000 micrometres: 1 mm = 1000 μm. Convert mm to μm by multiplying by 1000; convert μm to mm by dividing by 1000. Check scale: a micrometre is smaller than a millimetre, so the numerical value increases when a length is expressed in μm.
What to do in an assessment
- Write the conversion factor before moving the decimal point and retain the unit through the calculation.
In plain language
A micrometre is one-thousandth of a millimetre.
Self-check
Convert 0.085 mm to μm.
Show the answer
0.085 × 1000 = 85 μm.
Topic group
Movement into and out of cells
- Course content
Scope: Course content · Subject-content route: any of Core, Extended (Core and Supplement) · §3, Topic 3: §3.1 Core 1–5; §3.2 Core 1–6; §3.3 Core 1.
Open revision guidance
What to know
- Diffusion is the net movement of particles from higher to lower concentration, down a concentration gradient, as a result of random movement. The energy comes from particles' kinetic energy; particles continue moving randomly in both directions even when there is a net flow. Some substances diffuse across cell membranes. Oxygen moves from lungs to blood and respiring cells; carbon dioxide diffuses away, and dissolved solutes can move between cells and surroundings.
- Diffusion is faster with larger surface area, higher temperature, steeper concentration gradient and shorter distance. Model investigation: place differently sized agar cubes in equal indicator/acid volumes for equal times; rinse and compare decolourised depth or remaining colour. Repeat, change only cube size, and explain how surface-area-to-volume ratio and distance affect penetration. A cube model is not itself a cell.
- Water is a solvent for digestion, transport and excretion. Osmosis is water diffusing through a partially permeable membrane; water moves into or out of cells through their cell membrane. Water pressing outwards on plant cell walls supports the plant. Water-potential direction and detailed plant-cell states are treated separately in the Extended-only Supplement.
- Dialysis tubing method: tie soaked tubing, fill with a measured sucrose solution, remove air, tie, rinse, blot and weigh. Immerse for a fixed time, blot consistently and reweigh. Repeat; calculate percentage mass change = (final − initial)/initial × 100. Net mass gain supports water entry by osmosis. Control tubing length, solution concentration/volume, temperature and time; never taste solutions. For plant tissue, compare equal potato cylinders in known concentrations, measure initial/final mass, repeat and plot mean percentage change. Blot consistently; mass gain/loss indicates net water movement, not individual molecules.
- Active transport moves particles across membranes from lower to higher concentration, against the gradient, using energy from respiration. It can accumulate mineral ions in root cells even when soil concentration is lower. It is not diffusion or osmosis; in this example ions, not water, are actively transported.
What to do in an assessment
- Identify particle, membrane and concentration difference: down-gradient particles is diffusion; water crossing a partially permeable membrane is osmosis; uphill movement requiring respiratory energy is active transport.
- For an investigation, state independent variable, measured outcome, controlled variables, repeats and control/comparison. Say what the result supports and distinguish proxy/model observations from direct measurements.
In plain language
Particles spread down a concentration difference, water crosses a partly selective membrane, and cells use respiratory energy to move chosen particles uphill.
Self-check
A concentrated sucrose dialysis bag gains mass in water. What crossed the tubing and what does the result show?
Show the answer
Water crossed the partially permeable tubing by osmosis from the more dilute surroundings toward the more concentrated solution. The mass gain is evidence of net water entry; it is not evidence that sucrose crossed.
- Course content
Scope: Course content · Subject-content route: Extended (Core and Supplement) · §3, Topic 3: §3.2 Supplement 7–9; §3.3 Supplement 2–3.
Open revision guidance
What to know
- Water potential describes water's tendency to move. Water moves by osmosis from higher water potential (dilute solution) to lower water potential (concentrated solution) through a partially permeable membrane. State direction, gradient and membrane.
- In dilute surroundings, a plant cell takes up water, its vacuole expands and it becomes turgid; outward pressure against the wall is turgor pressure. In concentrated surroundings water leaves: the cell becomes flaccid as turgor falls; further loss makes the protoplast pull away from the wall (plasmolysis). These are distinct terms.
- Water potential/osmosis explain organism water uptake and loss: water may enter root-hair cells from soil or leave cells when outside water potential is lower. Plant cell walls resist expansion; animal cells have no wall.
- Active transport is needed to move molecules/ions against gradients across membranes, including root-hair uptake of mineral ions from dilute soil. Respiration supplies energy and membrane protein carriers move the selected particles; carriers do not turn the process into passive diffusion.
What to do in an assessment
- For an immersed plant cell, compare external and cell-sap water potential, state water direction, then link loss/gain to turgor and turgid, flaccid or plasmolysed state.
- For root-ion uptake, include against-gradient movement, respiratory energy and protein carriers.
In plain language
Water moves down a water-potential gradient through a partially permeable membrane; carriers and energy move selected particles uphill.
Self-check
A plant cell's protoplast pulls away from its wall in a concentrated solution. Explain.
Show the answer
Water leaves by osmosis toward lower water potential outside. The cell loses turgor and plasmolyses as its protoplast pulls away from the wall.
Topic group
Biological molecules
- Course content
Scope: Course content · Subject-content route: any of Core, Extended (Core and Supplement) · §3, Topic 4, §4.1 Core 1; 2(a)–(c); 3(a)–(e).
Open revision guidance
What to know
- Carbohydrates and fats/oils contain carbon, hydrogen and oxygen; proteins contain carbon, hydrogen, oxygen and nitrogen. Starch, glycogen and cellulose are made from glucose; proteins from amino acids; fats/oils from fatty acids and glycerol.
- Food tests: iodine + sample: blue-black indicates starch (negative orange-brown). Benedict's + sample, heated in a hot-water bath: blue may change through green/yellow/orange to brick-red precipitate for reducing sugar. Biuret reagent: lilac/purple indicates protein. For fat/oil, mix sample with ethanol, then add water: a cloudy white emulsion is positive. Blue DCPIP decolourised by sample indicates vitamin C.
- Use equal sample/reagent volumes and consistent heating/time; label tubes and prevent cross-contamination. To compare samples, use a dilution series or standardised drops against a fixed DCPIP volume and call it an estimate unless calibrated. Wear eye protection; never taste reagents; heat Benedict's in a water bath. Ethanol is flammable: keep it away from flames and follow teacher instructions.
What to do in an assessment
- Report test as sample + reagent/procedure → positive observation → inference; heat only the Benedict's test.
- A negative result means the positive indicator was not observed under those conditions, not proof that absolutely none is present.
In plain language
Biological molecules have characteristic building units and chemical tests with visible positive results.
Self-check
A sample turns Biuret lilac and gives a cloudy emulsion after ethanol and water. What is present?
Show the answer
Protein and fat/oil, respectively.
- Course content
Scope: Course content · Subject-content route: Extended (Core and Supplement) · §3, Topic 4, §4.1 Supplement 4(a)–(d).
Open revision guidance
What to know
- DNA consists of two strands coiled into a double helix. Each strand contains bases; bonds between paired bases hold the strands together. Bases always pair A with T and C with G; full base names are not required.
- To complete a simple strand, write the complementary partner opposite each base: for A C T G, the matching strand is T G A C. The strands are complementary, not identical.
What to do in an assessment
- Describe two coiled strands, bases on each and bonds between paired bases; apply A–T and C–G position by position.
In plain language
DNA is a double helix held together by specific A–T and C–G base pairs.
Self-check
What is complementary to A C T G?
Show the answer
T G A C.
Topic group
Enzymes
- Course content
Scope: Course content · Subject-content route: any of Core, Extended (Core and Supplement) · §3, Topic 5, §5.1 Core 1–5.
Open revision guidance
What to know
- A catalyst increases reaction rate and is not changed by the reaction. Enzymes are proteins acting as biological catalysts in metabolic reactions. Their reactions must be fast enough to sustain life.
- An enzyme's active site has a shape complementary to its substrate; substrate fits and product(s) form. Enzymes have optimum temperature and pH. Below an optimum, activity is lower; excessive temperature or unsuitable pH can denature the enzyme and change active-site shape so substrate no longer fits. Slower rate alone is not necessarily denaturation.
- Amylase/starch investigation: equilibrate equal measured solutions at a set water-bath temperature, mix and start timing; at fixed intervals place drops on iodine. Record time until iodine no longer turns blue-black. Test pH with buffers and fixed temperature. Keep concentrations/volumes, sampling interval and mixing consistent; repeat and compare mean time or rate (1/time). Wear eye protection; use a water bath, holder and tile, not a flame; do not ingest reagents.
- Illustrative hypothetical endpoint data: starch disappears in 180 s at 20°C, 70 s at 35°C and 240 s at 60°C. The 35°C condition is fastest in this example; the high-temperature result is consistent with denaturation. Three points do not establish the exact optimum, so test more temperatures around the fastest result.
What to do in an assessment
- On a graph, find the peak rate (or shortest time), describe both sides and explain with optimum/denaturation. Name variable, endpoint, controls and repeats in a method answer.
- Do not explain denaturation as simply faster molecular movement.
In plain language
Protein enzymes are catalysts whose substrate fit and activity depend on temperature and pH.
Self-check
Why could amylase take longer to digest starch at 60°C than 35°C in the example?
Show the answer
High temperature may denature the enzyme, changing active-site shape so starch fits less well. The example suggests but does not establish a universal optimum.
- Course content
Scope: Course content · Subject-content route: Extended (Core and Supplement) · §3, Topic 5, §5.1 Supplement 6–9.
Open revision guidance
What to know
- Substrate binds the active site to form an enzyme–substrate complex; the reaction forms product(s), which leave so the enzyme can act again. Specificity follows from complementary shape and fit.
- Below optimum temperature, rising kinetic energy increases movement and frequency of effective collisions, raising rate. Above optimum, denaturation changes shape/fit and rate falls. A pH change away from optimum alters fit; sufficiently extreme pH can denature the enzyme. Each enzyme has its own optimum.
- Fair test: change one variable only; buffer pH when testing pH, or control pH while changing temperature. Hold reactant/enzyme volume and concentration constant, define the endpoint, repeat and compare. Example only: faster starch disappearance at pH 7 than pH 3 supports greater amylase activity in those conditions, not a universal pH optimum.
What to do in an assessment
- Explain temperature by the chain kinetic energy → effective collisions → rising rate, then above optimum denaturation → changed fit → falling rate. Explain pH by shape/fit and denaturation, not kinetic energy.
- Use substrate, active site, enzyme–substrate complex and product accurately.
In plain language
Complementary fit makes enzyme reactions specific; conditions alter collision frequency or the enzyme's shape.
Self-check
Why can increased temperature help below, but hinder above, the optimum?
Show the answer
Below optimum it increases effective-collision frequency; above optimum it denatures the enzyme and changes active-site fit.
Topic group
Plant nutrition
- Course content
Scope: Course content · Subject-content route: any of Core, Extended (Core and Supplement) · §3, Topic 6: §6.1 Core 1–9, including 5(a)–(e), 6(a)–(b); §6.2 Core 1–3, including visual list in 2.
Open revision guidance
What to know
- Photosynthesis synthesises carbohydrate from raw materials using light energy: carbon dioxide + water → glucose + oxygen, in the presence of light and chlorophyll. Chlorophyll is a green pigment in chloroplasts and transfers light energy into chemical energy used in carbohydrate synthesis.
- Carbohydrate uses: starch stores energy; cellulose builds cell walls; glucose is used in respiration; sucrose is transported in phloem; nectar attracts pollinating insects. Nitrate ions are needed to make amino acids; magnesium ions to make chlorophyll.
- Starch test for photosynthesis: destarch plant in darkness, expose part/use suitable comparison, remove leaf, boil briefly in water, decolourise in ethanol using a hot-water bath, rinse and add iodine. Blue-black indicates starch. Compare covered/uncovered for light, green/non-green variegated areas for chlorophyll, or matched plants with/without available CO₂ using an appropriate absorbent. Keep other conditions alike. Ethanol is flammable: no naked flame; teacher-supervised water bath, eye protection and forceps.
- For environmental rate, count oxygen bubbles/volume from an aquatic plant over a fixed interval as a proxy. Change light intensity, CO₂ availability/concentration or temperature one at a time; control plant, time and other factors, allow equilibration and repeat. Lamp distance is only a proxy for intensity unless measured. Hypothetical example: 12, 22 and 23 bubbles/min as light rises suggests a plateau where another factor may limit; bubbles are not a direct glucose measurement. In light an aquatic plant may remove CO₂; in darkness respiration releases it. Hydrogencarbonate indicator shifts toward low-CO₂ colour in light and high-CO₂ colour in darkness; use equal sealed-tube conditions and a no-plant control as directed.
- Most leaves are thin and have large surface area, aiding light capture and short gas-diffusion distance. The named dicot-leaf structures are chloroplasts, cuticle, guard cells, stomata, upper/lower epidermis, palisade/spongy mesophyll, air spaces, vascular bundles, xylem and phloem. Textually: chloroplasts contain chlorophyll; palisade near upper surface captures light; air spaces aid diffusion; stomata/guard cells regulate gas exchange; veins deliver water and transport sucrose. Use the attached leaf-section diagram for labelled/unlabelled structure practice, then compare its tissue pattern with the authentic dicot-leaf micrograph; the photo alone does not resolve xylem/phloem.
What to do in an assessment
- Equation: products/reactants in correct direction; light and chlorophyll are conditions, not reactants. In experiments identify changed factor, measured proxy, controls and repeats.
- Starch-test order: destarch → expose/compare → boil water → ethanol in water bath → rinse → iodine. Practise leaf labels with the attached labelled/unlabelled dicot cross-section and compare it with the genuine leaf micrograph; use the diagram, not the photo, to check the finer label targets.
In plain language
Plants use light to make carbohydrates, and leaf structures support light capture, gas exchange and transport.
Self-check
After part of a destarched leaf is covered, only the uncovered region turns iodine blue-black. What does that support?
Show the answer
Starch was formed in the illuminated region but not the covered region, supporting the need for light in photosynthesis under these conditions.
View diagrams
Dicot leaf section · Unlabelled practice · Schematic, simplified and not to scale. Show labelled key: Answer key for leaf-section
Dicot leaf section · Structure key · Schematic, simplified and not to scale. Practice question
Read the section from its more regular, column-like tissue toward the looser tissue with larger spaces. Which leaf regions can you recognise, and where is the vein?
Photograph / micrograph recognition only. Species is not identified. This is a dicot example, but not a species-specific specimen.
Photo: Dicot leaf · Jon Houseman; source credit also names Matthew FordPhotomicrograph with a 0.2 mm scale bar.Show labelled key: Answer key for leaf-micrograph
Dicot leaf cross-section
Photo key
The source identifies this as a dicot leaf in transverse section. Elongated palisade tissue lies beneath the upper surface; looser spongy tissue with air spaces is toward the lower surface; a central vein is visible. Individual xylem and phloem are not resolved clearly enough here to label.
Species is not identified. This is a dicot example, but not a species-specific specimen.
Photo: Dicot leaf · Jon Houseman; source credit also names Matthew FordPhotomicrograph with a 0.2 mm scale bar.Identify leaf tissues on a teaching section diagram, then compare with the genuine dicot-leaf micrograph; the photo does not resolve xylem/phloem labels by itself. - Course content
Scope: Course content · Subject-content route: Extended (Core and Supplement) · §3, Topic 6, §6.1 Supplement 10–11.
Open revision guidance
What to know
- Balanced equation: 6CO₂ + 6H₂O → C₆H₁₂O₆ + 6O₂. Both sides contain six C, twelve H and eighteen O atoms. Light energy drives photosynthesis but is not a chemical reactant.
- A limiting factor is the factor restricting rate under current conditions. Increasing light, CO₂ or temperature may raise rate until another factor limits. Low light can make extra CO₂ ineffective; low CO₂ can limit a brightly lit plant; low temperature slows enzyme-controlled reactions and excessive heat can damage enzymes. Read graph conditions; do not assume a single factor always limits.
What to do in an assessment
- Check atom counts when balancing. On a rate graph, state trend, changed factor and whether it limits; a plateau can indicate another limiting condition.
In plain language
Photosynthesis conserves atoms, and the most restrictive required condition can limit its rate.
Self-check
Light is fixed and bright; adding CO₂ increases rate until a plateau. Interpret it.
Show the answer
CO₂ limited the rising section; at the plateau another condition such as light or temperature may limit further increase.
Topic group
Human nutrition
- Course content
Scope: Course content · Subject-content route: any of Core, Extended (Core and Supplement) · §3 Topic 7: §7.1 Core 1–3 incl. 2(a–g); §7.2 Core 1(a–b) diagram identification and 2(a–e); §7.3 Core 1–6 with Core 3 diagram identification; §7.4 Core 1–5 incl. 3(a–c); §7.5 Core 1–2. Separate actual-image recognition is tracked independently.
Open revision guidance
What to know
- A balanced diet supplies needed nutrients/energy in suitable amounts; needs vary with age, activity and health. Carbohydrates (bread/rice) supply energy; fats/oils (oils/nuts) supply and store energy; proteins (eggs/beans/fish) supply amino acids for growth/repair. Vitamin C (fruit/vegetables) supports healthy tissues; vitamin D (some foods/skin production) supports calcium use/bones. Calcium (dairy/fortified food) supports bones/teeth; iron (meat/beans/leafy vegetables) is needed for haemoglobin. Fibre from whole grains/fruit/vegetables aids movement of food; water is solvent and transport medium. Scurvy is caused by vitamin C deficiency; rickets is associated with vitamin D deficiency and inadequate calcium availability.
- Alimentary route: mouth → oesophagus → stomach → small intestine (duodenum, ileum) → large intestine (colon) → rectum → anus. Associated organs: salivary glands, pancreas, liver, gall bladder. Ingestion takes food/drink into body; digestion breaks food down; absorption moves nutrients from intestines into blood; assimilation is uptake/use by cells; egestion removes undigested food as faeces. Egestion is not excretion. Use the attached unlabelled digestive-system figure to locate the canal and accessory organs, then reveal the labelled key; the same card includes a separate keyed dentition practice view.
- Physical digestion breaks food into smaller pieces without chemical change and increases surface area for enzymes. Incisors cut, canines tear, premolars crush and molars grind; identify each tooth type using the attached unlabelled dentition figure and its keyed view. Teeth contain enamel, dentine and pulp with nerves/blood vessels, with cement; they are embedded in bone and gums. The stomach churns food. Bile emulsifies fats into droplets, increasing lipase surface area; it is physical dispersion, not chemical digestion.
- Chemical digestion converts large insoluble molecules into small soluble molecules for absorption. Amylase changes starch to simple reducing sugars; proteases change proteins to amino acids; lipase changes fats/oils to fatty acids and glycerol. Salivary glands and pancreas secrete amylase, which acts in mouth and small intestine; stomach and pancreas secrete proteases, which act in stomach and small intestine; pancreas secretes lipase, which acts in small intestine. Hydrochloric acid kills harmful microorganisms in food and provides acidic pH for optimum enzyme action.
- Nutrients are absorbed in the small intestine; most water is absorbed there, with some in colon. Drinks and water-rich foods are principal water sources. Distinguish absorption (gut into blood) from assimilation (use by cells).
What to do in an assessment
- For diet questions, name source and function; for deficiency, name nutrient and disease. Complete the attached digestive-system and dentition practice views, then check the closed keys as well as the structure/function explanation.
- Keep physical digestion (size/surface area, no chemical change) distinct from chemical digestion (molecule breakdown). Match each enzyme to substrate/products and secretion/action site; give both hydrochloric-acid roles.
- Use the attached schematic digestive-system and dentition diagrams for unlabelled practice and check their closed keys. Actual tooth-class image recognition is separately covered by the upper/lower occlusal model photos. Practise the named digestive organs on the labelled Blausen 3D image and pair it with the complete schematic/key for finer source targets.
In plain language
Food supplies nutrients; digestion makes small soluble molecules, intestines absorb them and cells assimilate them.
Self-check
Why does chewing bread help amylase digest starch?
Show the answer
Chewing is physical digestion: it makes smaller pieces without changing food molecules, increasing surface area available to amylase for chemical digestion.
View diagrams
Human digestive systemSimplified schematic; not to scale. - A
- B
- C
- D
- E
- F
- G
- H
- I
- J
- K
- L
- M
Show labelled key: Answer key for digestive-system
Human digestive systemSimplified schematic; not to scale. - AMouth
- BOesophagus
- CLiver
- DGall bladder
- EStomach
- FPancreas
- GDuodenum
- HIleum
- IColon
- JRectum
- KAnus
- LSalivary glands
- MBile duct
Human dentitionSimplified schematic; not to scale. - A
- B
- C
- D
Show labelled key: Answer key for dentition
Human dentitionSimplified schematic; not to scale. - AIncisor
- BCanine
- CPremolar
- DMolar
Practise identifying alimentary organs and accessory organs in anatomical position, and all four human tooth types; check the separately keyed structures. - Course content
Scope: Course content · Subject-content route: Extended (Core and Supplement) · §3, Topic 7: §7.3 Supplement 7; §7.4 Supplement 6(a)–(b), 7(a)–(b), 8; §7.5 Supplement 3–5.
Open revision guidance
What to know
- Bile emulsifies fats/oils into droplets, increasing area for lipase. Alkaline bile neutralises acidic food and gastric juice entering the duodenum, providing suitable pH for intestinal enzymes. Bile is not an enzyme.
- Starch: amylase → maltose; maltase on small-intestine epithelial membranes → glucose. Protein: pepsin acts in acidic stomach; trypsin acts in alkaline small intestine. Match enzyme, substrate, product, site and conditions.
- Villi and microvilli increase internal small-intestine surface area. A villus projects from lining, has a thin epithelial surface, capillary network and central lacteal. Capillaries absorb water-soluble products such as glucose/amino acids into blood; lacteals take up absorbed fat products.
- Worked pathway: starch is converted to maltose then glucose; protein is digested to amino acids by stomach/intestinal proteases. Glucose and amino acids enter villus capillaries; fat products enter lacteals. Bile supports fat digestion by emulsification and supports enzyme conditions by neutralising acid.
What to do in an assessment
- Enzyme table: amylase starch→maltose; maltase maltose→glucose on small-intestine epithelium; pepsin protein digestion in acidic stomach; trypsin protein digestion in alkaline small intestine.
- Explain villi with large area, thin epithelium and separate capillary/lacteal transport roles; do not reverse these roles.
In plain language
Bile prepares fats and neutralises acid; enzymes finish digestion and villi route absorbed products into blood or lymph.
Self-check
What does bile contribute when acidic stomach contents enter the duodenum?
Show the answer
Alkaline bile neutralises acidity for enzyme action; emulsification also increases fat surface area for lipase. Bile itself is not an enzyme.
Topic group
Transport in plants
- Course content
Scope: Course content · Subject-content route: any of Core, Extended (Core and Supplement) · §3, Topic 8, §§8.1–8.3, Core outcomes 1(a)–(b), 2; 8.2 outcomes 1–4; 8.3 outcomes 1–3.
Open revision guidance
What to know
- Xylem carries water and mineral ions from roots and also supports the plant; phloem transports sucrose and amino acids. In a non-woody dicot root, xylem is central and phloem lies between its arms; in a stem, xylem is toward the inside of each vascular bundle and phloem toward the outside; in a leaf vein, xylem is on the upper side and phloem below it. Practise locating both tissues in a labelled cross-section rather than identifying a bundle by position alone.
- A root hair cell is an epidermal cell with a long projection; its large surface area increases contact with soil water and dissolved mineral ions. Water passes from root-hair cells through root-cortex cells into xylem, travels up the stem, then enters leaf mesophyll cells. A stain experiment makes the route visible: place a freshly cut leafy shoot in coloured water, keep an unstained shoot as a comparison, then cut transverse sections of stem and leaf and record where colour appears.
- Transpiration is loss of water vapour from leaves. Water evaporates from moist mesophyll-cell surfaces into air spaces and diffuses out through stomata. A simple bubble potometer uses a water-filled capillary tube, reservoir and airtight shoot connections; it estimates water uptake, not water loss directly. Seal joints, cut the shoot under water, introduce one air bubble, allow equilibration, then measure bubble movement over a fixed time. Change one factor at a time, repeat, and keep leaf area and apparatus conditions constant.
- Worked stain result (illustrative classroom observation): put a freshly cut celery or leafy shoot in water coloured with food dye for 30 minutes; a matching shoot in clear water is the control. After cutting stem and leaf sections with teacher supervision, coloured xylem is visible in the stem and leaf veins while the control remains unstained. Infer that water travelled in xylem through above-ground parts of the plant. Use non-toxic food dye, do not eat plant material, and cut away from fingers.
- Worked potometer dataset (simulated means of three repeats, fixed 10-minute interval; bubble displacement in mm; same shoot leaf area, light and humidity): baseline 20°C/still air = 8 mm; 30°C/still air = 13 mm; 20°C/gentle fan = 12 mm. Temperature comparison is baseline versus 30°C; wind comparison is baseline versus fan. Greater uptake is consistent with faster transpiration but is not a direct water-loss measurement. Keep each change isolated, re-zero the bubble, repeat and compare means; teacher demonstration or supplied data is sufficient.
What to do in an assessment
- For a tissue-location question, orient the root/stem/leaf section first, then use the xylem/phloem positional pattern and annotate the evidence. For a water-pathway question, write the route in order: root hair → cortex → xylem → mesophyll.
- In a potometer comparison, state the changed factor, the measured bubble distance or rate, at least two controlled variables, repeats and a mean. Do not claim the apparatus directly measures transpiration.
In plain language
Roots absorb water, xylem carries it to leaves, and evaporation from leaves drives water loss; phloem carries dissolved food between plant regions.
Self-check
A stained shoot has coloured xylem but unstained cortex at the top of its stem. What does that show, and what further observation would support the route into a leaf?
Show the answer
The stain shows water moved into and along the xylem. A leaf section with stain in the vein xylem, followed by stained mesophyll near the vein, would support the onward route from xylem to leaf tissues.
View diagrams
Dicot leaf section · Unlabelled practice · Schematic, simplified and not to scale. Show labelled key: Answer key for leaf-section
Dicot leaf section · Structure key · Schematic, simplified and not to scale. Practice question
Read the section from its more regular, column-like tissue toward the looser tissue with larger spaces. Which leaf regions can you recognise, and where is the vein?
Photograph / micrograph recognition only. Species is not identified. This is a dicot example, but not a species-specific specimen.
Photo: Dicot leaf · Jon Houseman; source credit also names Matthew FordPhotomicrograph with a 0.2 mm scale bar.Show labelled key: Answer key for leaf-micrograph
Dicot leaf cross-section
Photo key
The source identifies this as a dicot leaf in transverse section. Elongated palisade tissue lies beneath the upper surface; looser spongy tissue with air spaces is toward the lower surface; a central vein is visible. Individual xylem and phloem are not resolved clearly enough here to label.
Species is not identified. This is a dicot example, but not a species-specific specimen.
Photo: Dicot leaf · Jon Houseman; source credit also names Matthew FordPhotomicrograph with a 0.2 mm scale bar.Non-woody dicot root section · Unlabelled practice · Schematic, simplified and not to scale. Show labelled key: Answer key for dicot-root-section
Non-woody dicot root section · Structure key · Schematic, simplified and not to scale. Non-woody dicot stem section · Unlabelled practice · Schematic, simplified and not to scale. Show labelled key: Answer key for dicot-stem-section
Non-woody dicot stem section · Structure key · Schematic, simplified and not to scale. Root-hair cell · Unlabelled practice · Schematic, simplified and not to scale. Show labelled key: Answer key for root-hair-cell
Root-hair cell · Structure key · Schematic, simplified and not to scale. Enlarged view of the same central region
Practice question
Find the compact vascular region at the centre of the section. What arrangement can you recognise there, and how is it positioned relative to the surrounding tissue?
Photograph / micrograph recognition only. The full-frame centre is compact and the arms are easier to inspect in the enlargement below. No scale bar is shown (the source title gives 100×, not a specimen scale). This real specimen is a mature Ranunculus root; do not generalise its exact appearance to every root.
Photo: Herbaceous Dicot Root Mature Ranunculus (100x) · Berkshire Community College Bioscience Image LibrarySource page describes radial vascular bundles.Show labelled key: Answer key for root-micrograph
Mature Ranunculus root cross-section
Enlarged view of the same central region
Photo key
This is a mature Ranunculus (buttercup) root. The enlarged centre shows the vascular region: xylem forms central arms, with phloem between the arms. The photo is unlabelled; boundaries are not drawn on the specimen.
The full-frame centre is compact and the arms are easier to inspect in the enlargement below. No scale bar is shown (the source title gives 100×, not a specimen scale). This real specimen is a mature Ranunculus root; do not generalise its exact appearance to every root.
Photo: Herbaceous Dicot Root Mature Ranunculus (100x) · Berkshire Community College Bioscience Image LibrarySource page describes radial vascular bundles.Practice question
Notice the repeated bundles around the outside of the section. What pattern do they make, and what occupies the broad middle?
Photograph / micrograph recognition only. The source identifies a young herbaceous dicot stem with primary vascular tissue. No scale bar is shown (the source title gives 40×, not a specimen scale). Individual xylem and phloem regions are not resolved well enough for a recognition label.
Photo: Herbaceous Dicot Stem Young Helianthus (40x) · Berkshire Community College Bioscience Image LibraryTransverse section of a young herbaceous dicot stem.Show labelled key: Answer key for stem-micrograph
Young Helianthus stem cross-section
Photo key
This is a young, herbaceous Helianthus (sunflower) dicot stem. Its vascular bundles form a ring near the outside, surrounding a large central pith. Individual xylem and phloem regions are too small to distinguish confidently in this unlabelled image; use a diagram for their relative positions within a bundle.
The source identifies a young herbaceous dicot stem with primary vascular tissue. No scale bar is shown (the source title gives 40×, not a specimen scale). Individual xylem and phloem regions are not resolved well enough for a recognition label.
Photo: Herbaceous Dicot Stem Young Helianthus (40x) · Berkshire Community College Bioscience Image LibraryTransverse section of a young herbaceous dicot stem.Practice question
What fine projections extend from the root surface into the surrounding soil? How might many such projections affect contact with soil water and dissolved mineral ions?
Photograph / micrograph recognition only. This macro photograph shows numerous root hairs against soil, not the internal structure or boundary of one individual root-hair cell. No scale is provided.
Photo: Cucurbita maxima root hairs · Josef SchlagheckenClose-up photograph; no scale provided.Show labelled key: Answer key for root-hair-photo
Cucurbita maxima root hairs
Photo key
The fine projections are root hairs. They are extensions of root epidermal cells; their large combined surface area increases contact with soil water and dissolved mineral ions.
This macro photograph shows numerous root hairs against soil, not the internal structure or boundary of one individual root-hair cell. No scale is provided.
Photo: Cucurbita maxima root hairs · Josef SchlagheckenClose-up photograph; no scale provided.Compare diagram and authentic leaf, root and stem sections for vascular positions, then identify root-hair cell structure and compare with the external root-hair macrophoto; do not infer invisible interiors. - Course content
Scope: Course content · Subject-content route: Extended (Core and Supplement) · §3, Topic 8, §8.1 Supplement outcome 3(a)–(c); §8.3 outcomes 4–7; §8.4 outcomes 1, 2(a)–(b), 3.
Open revision guidance
What to know
- Xylem vessels conduct water and mineral ions and help support the plant: lignin thickens their walls, the conducting elements have no cell contents, and cells join end-to-end without cross-walls to form a continuous tube. Lignified thick walls strengthen the plant and resist collapse; empty vessel elements joined into one continuous tube provide an unobstructed water pathway. In a transpiring leaf, evaporation from mesophyll surfaces and diffusion through stomata lower water potential in the leaf; cohesion between water molecules keeps the xylem water column together as transpiration pull draws it upward.
- Water-vapour loss depends on the large internal mesophyll surface exposed to connected air spaces and on stomatal number and size. Higher temperature generally speeds evaporation and diffusion; moving air removes humid air near the leaf and usually increases loss; higher humidity reduces the water-vapour gradient and slows loss. Wilting occurs when water loss exceeds uptake: cells lose turgor, so leaves and stems become limp.
- Translocation is movement of sucrose and amino acids in phloem from sources (parts releasing them) to sinks (parts using or storing them). A mature photosynthesising leaf is commonly a sucrose source; a growing shoot, root, fruit or storage organ is a sink. The same storage organ can change role: a tuber stores sucrose in one season but releases it to growing shoots later. These are source–sink roles, not fixed tissue labels.
What to do in an assessment
- When explaining a transpiration-rate graph, trace the factor to the water-vapour gradient or evaporation/diffusion step, then state the predicted direction. For wilting, connect net water loss to reduced cell turgor.
- For source/sink scenarios, identify whether the tissue is releasing or using/storing sucrose or amino acids at that time; do not label a plant organ as permanently one or the other.
In plain language
The pull from evaporating water draws a cohesive water column through xylem; phloem redistributes soluble food from current sources to current sinks.
Self-check
A plant is moved from still, humid air to warm, dry, moving air. Predict the transpiration change and explain two causes.
Show the answer
Transpiration is expected to increase: warmth speeds evaporation, while moving dry air maintains a steep water-vapour gradient at the leaf surface. (The prediction assumes other factors, such as light and stomatal state, are unchanged.)
Topic group
Transport in animals
- Course content
Scope: Course content · Subject-content route: any of Core, Extended (Core and Supplement) · §3, Topic 9, §§9.1–9.4, Core outcomes 1; 9.2 outcomes 1–6; 9.3 outcomes 1–3(a)–(c); 9.4 outcomes 1–4, including 9.4 outcome 3(a)–(d).
Open revision guidance
What to know
- A circulatory system has a pump, blood vessels and valves that maintain one-way blood flow. The heart has four chambers separated by a septum; identify the atria above the ventricles, the one-way valves between chambers/at exits, and the coronary arteries on the heart surface. Arteries carry blood away from the heart, veins return it, and capillaries connect small vessels in tissues. Trace: vena cava → right heart → pulmonary artery → lungs → pulmonary vein → left heart → aorta → body; renal artery and renal vein serve the kidney.
- Arteries have thicker walls than veins, reflecting higher pressure; veins have a larger lumen and valves to prevent backflow at lower pressure. Capillaries have very thin walls and a narrow lumen. They exchange materials between blood and tissues. Blood comprises red cells, white cells, platelets and plasma: haemoglobin in red cells carries oxygen; white cells carry out phagocytosis and antibody production; platelets aid clotting; plasma carries cells, ions, nutrients, urea, hormones and carbon dioxide. Clotting prevents blood loss and pathogen entry.
- Coronary heart disease is associated with blockage of coronary arteries. Risk factors include diet, inactivity, stress, smoking, genetic predisposition, age and sex; balanced diet and regular exercise can reduce risk. Heart activity may be monitored by ECG, pulse rate or listening to valve sounds. For an exercise investigation, use the same pulse-count interval and posture, record a resting value, use a defined activity duration/intensity, measure immediately and at recovery intervals, repeat safely, and compare.
- Worked safe-classroom pulse example (simulated teacher-provided data): count a radial pulse for 15 seconds and multiply by four; one-minute low-intensity stepping gives 72 beats/min at rest, 118 immediately after, and 82 after three minutes' recovery. The rise after activity and fall during recovery fit increased cardiac output during exercise. If a practical is done, teacher supervision, participant choice, a low step, a clear stop rule for discomfort and no pressure to exercise are required; otherwise analyse the supplied dataset.
What to do in an assessment
- On a heart or vessel diagram, trace the path with arrows and label each vessel by direction and destination before stating oxygenation; do not infer oxygenation from artery/vein names.
- Compare vessel sections using wall thickness, lumen size and valves, linking each feature to pressure or flow. In data questions, compare pulse rate with a clear baseline and identify whether the measurement is at rest, immediately after activity or during recovery.
In plain language
The heart pumps blood through vessels; blood transports materials, exchanges them with tissues and helps defend the body.
Self-check
A blood vessel has a thin wall, a wide lumen and valves. Identify it and explain why its valves matter.
Show the answer
It is a vein. Blood in veins is at relatively low pressure, so valves prevent backflow and help maintain return toward the heart.
View diagrams
Section through the human heartSimplified schematic; not to scale. - A
- B
- C
- D
- E
- F
- G
- H
- I
- J
- K
- L
- M
- N
Show labelled key: Answer key for heart-section
Section through the human heartSimplified schematic; not to scale. - ARight atrium
- BRight ventricle
- CLeft atrium
- DLeft ventricle
- ESeptum
- FMuscular wall
- GTricuspid valve
- HBicuspid (mitral) valve
- ISemilunar valves
- JCoronary arteries
- KVena cava
- LPulmonary artery
- MPulmonary vein
- NAorta
Double circulation and major vesselsColour indicates oxygenation, not artery or vein type. Simplified schematic; not to scale. - A
- B
- C
- D
- E
- F
- G
- H
- I
- J
- K
- L
- M
- N
Show labelled key: Answer key for circulation-vessels
Double circulation and major vesselsColour indicates oxygenation, not artery or vein type. Simplified schematic; not to scale. - AHeart
- BLungs
- CPulmonary artery: heart → lungs
- DPulmonary vein: lungs → heart
- EAorta: away from heart
- FVena cava: to heart
- GGut
- HHepatic portal vein: gut → liver
- ILiver
- JHepatic artery: to liver
- KHepatic veins: from liver
- LKidney
- MRenal artery: to kidney
- NRenal vein: from kidney
Blood cells: schematic, not a photomicrographSchematic shapes only. Actual representative photomicrographs must be supplied separately; this drawing is not a specimen. - A
- B
- C
- D
- E
- F
Show labelled key: Answer key for blood-cells
Blood cells: schematic, not a photomicrographSchematic shapes only. Actual representative photomicrographs must be supplied separately; this drawing is not a specimen. - ARed blood cell: biconcave, no nucleus
- BPhagocyte
- CPhagocyte nucleus
- DLymphocyte
- ELymphocyte nucleus
- FPlatelets
Practice question
Compare the many pale disc-shaped cells with the larger purple-stained cell near the centre. Which is the red blood cell type, and what kind of white blood cell is visible?
Photograph / micrograph recognition only. This small unlabelled field contains erythrocytes and a neutrophil, not a lymphocyte. No scale bar is shown.
Photo: Blood-neutrophil1 · EchinaceapallidaWright-stained human peripheral blood smear.Show labelled key: Answer key for blood-smear-micrograph
Human blood smear
Photo key
The numerous pale cells are erythrocytes (red blood cells). The larger purple-stained cell is a neutrophil, identified by its segmented nucleus.
This small unlabelled field contains erythrocytes and a neutrophil, not a lymphocyte. No scale bar is shown.
Photo: Blood-neutrophil1 · EchinaceapallidaWright-stained human peripheral blood smear.Practice question
Inspect the prominent purple-stained white blood cell. What shape does its dark-stained nucleus have?
Photograph / micrograph recognition only. Small, tightly framed micrograph; only part of the surrounding smear is visible. No scale bar or specimen scale is given.
Photo: Neutrophil in a blood smear · Original image: hematologist (Segmented_neutrophils.jpg); derivative work: patient-docDerivative image; source page credits the original image and derivative work.Show labelled key: Answer key for neutrophil-micrograph
Neutrophil in a blood smear
Photo key
It is a neutrophil. The visible nucleus is segmented into several lobes; nearby erythrocytes provide context, not a scale reference.
Small, tightly framed micrograph; only part of the surrounding smear is visible. No scale bar or specimen scale is given.
Photo: Neutrophil in a blood smear · Original image: hematologist (Segmented_neutrophils.jpg); derivative work: patient-docDerivative image; source page credits the original image and derivative work.Practice question
Compare the lymphocyte with the surrounding red blood cells. What can you observe about its dark central region and the amount of cytoplasm around it?
Photograph / micrograph recognition only. The image does not include a scale bar. No donor health status or diagnosis is provided by the source.
Show labelled key: Answer key for lymphocyte-micrograph
Lymphocyte in a human blood smear
Photo key
The cell is a human lymphocyte. It has a prominent, rounded dark nucleus and a narrow rim of cytoplasm. The source does not identify the donor’s health status.
The image does not include a scale bar. No donor health status or diagnosis is provided by the source.
Practise heart orientation/chambers/valves, systemic and pulmonary vessel routes, and blood-cell identification; compare diagrams with separate authentic smear, neutrophil and lymphocyte micrographs. - Course content
Scope: Course content · Subject-content route: Extended (Core and Supplement) · §3, Topic 9, §9.1 Supplement outcomes 2–4; §9.2 outcomes 7–11; §9.3 outcomes 4–6; §9.4 outcomes 5, 6(a)–(b), 7.
Open revision guidance
What to know
- Fish have single circulation: heart → gills → body → heart, so blood passes through the heart once per complete circuit. Mammals have double circulation: right heart → lungs → left heart → body → right heart. This keeps pulmonary and systemic circuits distinct and allows blood to be pumped again before the body circuit.
- The left ventricle has the thickest muscular wall because it pumps at high pressure around the body; the right ventricle pumps only to the lungs. Atria have thinner walls because they push blood only into ventricles. The septum prevents mixing of oxygenated and deoxygenated blood. Atrial contraction pushes blood into ventricles; ventricular contraction closes atrioventricular valves and opens semilunar valves, ejecting blood. Relaxation lets the chambers refill and valves prevent reverse flow. Exercise raises heart rate to increase delivery of oxygen and glucose to respiring muscles and removal of carbon dioxide.
- Arterial elastic, muscular walls withstand and smooth high-pressure pulses; veins return lower-pressure blood through a wide lumen and valves. Capillary walls are one cell thick and close to cells, supporting short diffusion distances; their networks provide a large exchange area. The hepatic artery brings oxygenated blood to the liver, hepatic veins carry blood away, and the hepatic portal vein brings nutrient-rich blood from the gut. Lymphocytes make antibodies, while phagocytes engulf pathogens by phagocytosis. During clotting, soluble fibrinogen is converted to insoluble fibrin threads that form a mesh trapping blood cells.
What to do in an assessment
- For a circulation comparison, draw each circuit as an ordered arrow chain and count heart passages in one full circuit. For valve questions, state which chamber is contracting and the resulting valve state/direction of flow.
- For vessel-function questions, connect wall/lumen/valve evidence to the pressure and task. Distinguish hepatic artery, hepatic vein and hepatic portal vein by destination/source, not just by the word 'liver'.
In plain language
Double circulation separates lung and body flow, while heart and vessel structures control pressure and exchange; blood cells and fibrin support defence and clotting.
Self-check
Why does blood pass through the heart twice in a mammal's complete circuit, and why is the left ventricle stronger than the right?
Show the answer
The two passages separate pulmonary and systemic circuits and restore pressure after the lungs before blood travels around the body. The left ventricle needs a thicker muscular wall to generate the higher systemic pressure; the right pumps only to the nearby lungs.
View diagrams
Section through the human heartSimplified schematic; not to scale. - A
- B
- C
- D
- E
- F
- G
- H
- I
- J
- K
- L
- M
- N
Show labelled key: Answer key for heart-section
Section through the human heartSimplified schematic; not to scale. - ARight atrium
- BRight ventricle
- CLeft atrium
- DLeft ventricle
- ESeptum
- FMuscular wall
- GTricuspid valve
- HBicuspid (mitral) valve
- ISemilunar valves
- JCoronary arteries
- KVena cava
- LPulmonary artery
- MPulmonary vein
- NAorta
Double circulation and major vesselsColour indicates oxygenation, not artery or vein type. Simplified schematic; not to scale. - A
- B
- C
- D
- E
- F
- G
- H
- I
- J
- K
- L
- M
- N
Show labelled key: Answer key for circulation-vessels
Double circulation and major vesselsColour indicates oxygenation, not artery or vein type. Simplified schematic; not to scale. - AHeart
- BLungs
- CPulmonary artery: heart → lungs
- DPulmonary vein: lungs → heart
- EAorta: away from heart
- FVena cava: to heart
- GGut
- HHepatic portal vein: gut → liver
- ILiver
- JHepatic artery: to liver
- KHepatic veins: from liver
- LKidney
- MRenal artery: to kidney
- NRenal vein: from kidney
Blood cells: schematic, not a photomicrographSchematic shapes only. Actual representative photomicrographs must be supplied separately; this drawing is not a specimen. - A
- B
- C
- D
- E
- F
Show labelled key: Answer key for blood-cells
Blood cells: schematic, not a photomicrographSchematic shapes only. Actual representative photomicrographs must be supplied separately; this drawing is not a specimen. - ARed blood cell: biconcave, no nucleus
- BPhagocyte
- CPhagocyte nucleus
- DLymphocyte
- ELymphocyte nucleus
- FPlatelets
Practice question
Compare the many pale disc-shaped cells with the larger purple-stained cell near the centre. Which is the red blood cell type, and what kind of white blood cell is visible?
Photograph / micrograph recognition only. This small unlabelled field contains erythrocytes and a neutrophil, not a lymphocyte. No scale bar is shown.
Photo: Blood-neutrophil1 · EchinaceapallidaWright-stained human peripheral blood smear.Show labelled key: Answer key for blood-smear-micrograph
Human blood smear
Photo key
The numerous pale cells are erythrocytes (red blood cells). The larger purple-stained cell is a neutrophil, identified by its segmented nucleus.
This small unlabelled field contains erythrocytes and a neutrophil, not a lymphocyte. No scale bar is shown.
Photo: Blood-neutrophil1 · EchinaceapallidaWright-stained human peripheral blood smear.Practice question
Inspect the prominent purple-stained white blood cell. What shape does its dark-stained nucleus have?
Photograph / micrograph recognition only. Small, tightly framed micrograph; only part of the surrounding smear is visible. No scale bar or specimen scale is given.
Photo: Neutrophil in a blood smear · Original image: hematologist (Segmented_neutrophils.jpg); derivative work: patient-docDerivative image; source page credits the original image and derivative work.Show labelled key: Answer key for neutrophil-micrograph
Neutrophil in a blood smear
Photo key
It is a neutrophil. The visible nucleus is segmented into several lobes; nearby erythrocytes provide context, not a scale reference.
Small, tightly framed micrograph; only part of the surrounding smear is visible. No scale bar or specimen scale is given.
Photo: Neutrophil in a blood smear · Original image: hematologist (Segmented_neutrophils.jpg); derivative work: patient-docDerivative image; source page credits the original image and derivative work.Practice question
Compare the lymphocyte with the surrounding red blood cells. What can you observe about its dark central region and the amount of cytoplasm around it?
Photograph / micrograph recognition only. The image does not include a scale bar. No donor health status or diagnosis is provided by the source.
Show labelled key: Answer key for lymphocyte-micrograph
Lymphocyte in a human blood smear
Photo key
The cell is a human lymphocyte. It has a prominent, rounded dark nucleus and a narrow rim of cytoplasm. The source does not identify the donor’s health status.
The image does not include a scale bar. No donor health status or diagnosis is provided by the source.
Practise heart orientation/chambers/valves, systemic and pulmonary vessel routes, and blood-cell identification; compare diagrams with separate authentic smear, neutrophil and lymphocyte micrographs.
Topic group
Diseases and immunity
- Course content
Scope: Course content · Subject-content route: any of Core, Extended (Core and Supplement) · §3, Topic 10, §10.1, Core outcomes 1–5, including outcome 3(a)–(b) and outcome 5(a)–(e).
Open revision guidance
What to know
- A pathogen is a disease-causing organism. A transmissible disease is one whose pathogen can pass from one host to another. Transmission may be direct, including blood and other body fluids, or indirect from contaminated surfaces, food, animals or air. Link the route to a control: clean water and sewage treatment interrupt water-borne spread; hygienic food preparation and hand hygiene limit faecal–oral transfer; safe waste disposal removes sources of contamination.
- The body's first-line physical and chemical defences include skin, hairs in the nose, mucus and stomach acid; white blood cells defend against pathogens. Explain prevention by breaking a specific link in transmission rather than listing measures without a route. For example, safe drinking water prevents ingestion of water contaminated with an enteric pathogen, while covering a cough reduces droplets reaching another host.
What to do in an assessment
- In an unfamiliar disease scenario, identify the source and route first, then choose the measure that blocks that route. Distinguish direct contact from indirect transfer via an intermediate such as a surface, food, animal or air.
In plain language
Pathogens cause disease and spread between hosts; body barriers and sanitation reduce the chance of transmission.
Self-check
A community has repeated disease after drinking from a contaminated well. Name two different controls and explain how each interrupts transmission.
Show the answer
Provide a clean treated water supply so the pathogen is not ingested, and safely dispose of waste/sewage so contamination does not reach the well. Each removes a link between the pathogen source and the next host.
- Course content
Scope: Course content · Subject-content route: Extended (Core and Supplement) · §3, Topic 10, §10.1, Supplement outcomes 6–17, including outcome 11(a)–(c).
Open revision guidance
What to know
- Active immunity is defence made by the person's own antibody production. Each pathogen has its own specifically shaped antigens; antibodies are proteins with complementary shapes that bind those antigens. Binding may directly destroy pathogens or mark them for destruction by phagocytes. After infection or vaccination, lymphocytes respond and memory cells remain, so later exposure can trigger a faster response.
- Vaccination introduces weakened pathogens or their antigens. These stimulate lymphocytes to make specific antibodies and memory cells, providing long-term active immunity. High vaccination coverage reduces the number of susceptible hosts and therefore the opportunities for transmission, helping protect both vaccinated people and the wider population. Passive immunity instead transfers ready-made antibodies from another individual: across the placenta or in breast milk. It acts quickly but is short-term, and the recipient makes no memory cells; breast-feeding can therefore provide infants temporary antibody protection.
- Cholera is caused by a bacterium transmitted in contaminated water. Its toxin causes chloride ions to be secreted into the small intestine; water follows by osmosis into the gut, causing diarrhoea. The resulting loss of water dehydrates the person and the loss of ions disrupts blood composition. In an explanation, keep the causal sequence complete: toxin → chloride secretion → osmotic water movement → diarrhoea → dehydration and ion loss.
What to do in an assessment
- When comparing immunity, identify the source of antibodies, whether the person's lymphocytes made them, how long protection lasts and whether memory cells form. Do not call transferred maternal antibodies vaccination or active immunity.
- For vaccination questions, give the antigen stimulus, lymphocyte antibody response, memory-cell outcome and population-level effect in order. For cholera, use the full ion/osmosis chain rather than saying the toxin simply 'causes diarrhoea'.
In plain language
Active immunity trains a person's own immune system and can leave memory; passive immunity lends antibodies temporarily. Vaccination limits spread, while cholera toxin drives intestinal water loss.
Self-check
A vaccinated person meets the same pathogen months later. Explain why protection can be faster than the first response, and contrast this with antibodies received through breast milk.
Show the answer
Vaccination has produced memory cells; on re-exposure these cells enable a faster antibody response. Breast milk transfers antibodies made by another individual, giving temporary passive protection without producing the infant's memory cells.
Topic group
Gas exchange in humans
- Course content
Scope: Course content · Subject-content route: any of Core, Extended (Core and Supplement) · §3, Topic 11, §11.1, Core outcomes 1–5.
Open revision guidance
What to know
- Human gas-exchange surfaces have a large area, a thin surface, a good blood supply and good ventilation with air; these features maintain rapid diffusion between alveolar air and blood. Locate the lungs, diaphragm, ribs, intercostal muscles, larynx, trachea, bronchi, bronchioles, alveoli and associated capillaries in the route from air entry to exchange.
- Inspired air contains more oxygen and less carbon dioxide than expired air; expired air contains more water vapour. Limewater tests carbon dioxide: bubble equal volumes of inspired and expired air through equal limewater samples under the same conditions and compare cloudiness, using fresh samples and a consistent flow/time. For an exercise investigation, use a safe, standardised activity, count breaths over the same interval at rest and after activity, repeat and record recovery; compare both rate and depth.
- Worked limewater method and result: a teacher provides equal 50 cm³ samples of room air and expired air in labelled gas syringes. Pass each through 10 cm³ fresh limewater at the same slow rate, using separate clean tubing and eye protection; never suck gas through limewater. In a model observation, room air leaves limewater clear or only faintly cloudy after 20 seconds, while expired air turns it milky sooner. This supports the greater carbon-dioxide content of expired air.
- Worked breathing dataset (simulated; one-minute count and single-user spirometer readings, no shared mouthpieces): rest = 14 breaths/min and 0.5 L tidal volume; immediately after one minute of gentle stepping = 25 breaths/min and 0.9 L; after three minutes' recovery = 17 breaths/min and 0.6 L. Rate and depth both rise with activity and move toward baseline during recovery. A teacher may instead provide these data; no learner needs to exercise. For practical work use a clean disposable mouthpiece, supervision and a stop rule for discomfort.
What to do in an assessment
- For a gas-composition comparison, state the direction for each gas (oxygen decreases, carbon dioxide and water vapour increase in expired air). In a limewater test, name the measured observation and keep sample volume, limewater volume and bubbling conditions comparable.
- For system diagrams, follow the air route and distinguish conducting tubes from alveoli; an unlabeled label line should point to the actual structure rather than nearby tissue.
In plain language
Ventilation refreshes alveolar air, and a thin, well-supplied surface allows oxygen and carbon dioxide to diffuse efficiently.
Self-check
Why should inspired and expired air be bubbled through equal volumes of limewater for equal periods?
Show the answer
Those controls make the comparison fair: a greater change in cloudiness can then be attributed to a difference in carbon dioxide content rather than unequal limewater amount or exposure time.
View diagrams
Human breathing systemSimplified schematic; not to scale. - A
- B
- C
- D
- E
- F
- G
- H
- I
- J
- K
Show labelled key: Answer key for breathing-system
Human breathing systemSimplified schematic; not to scale. - ALarynx
- BTrachea
- CBronchi
- DBronchioles
- EAlveoli
- FCapillaries
- GLung
- HRibs
- IIntercostal muscles
- JDiaphragm
- KNasal cavity
Intercostal muscles between two ribsSimplified schematic; not to scale. - A
- B
- C
- D
- E
- F
Show labelled key: Answer key for intercostal-muscles
Intercostal muscles between two ribsSimplified schematic; not to scale. - ARib above
- BRib below
- CExternal intercostal: fibres down and forwards
- DInternal intercostal: fibres down and backwards
- ESternum (front)
- FVertebra (back)
Identify airway, lungs, alveolus/capillary and diaphragm structures, then distinguish internal and external intercostal muscles in section. - Course content
Scope: Course content · Subject-content route: Extended (Core and Supplement) · §3, Topic 11, §11.1, Supplement outcomes 6–11.
Open revision guidance
What to know
- Cartilage supports the trachea and prevents its airway from collapsing. During inspiration, external intercostal muscles contract, ribs move up and out, and the diaphragm contracts and flattens; thoracic volume rises, pressure falls below atmospheric pressure and air enters. During quiet expiration, these muscles relax, ribs move down and in, diaphragm domes, volume falls, pressure rises and air leaves. Internal intercostal muscles can assist forced expiration.
- Physical activity increases muscle respiration and carbon dioxide concentration in blood. The brain detects the rise and coordinates faster, deeper breathing, increasing ventilation to remove carbon dioxide. Goblet cells make mucus that traps particles and pathogens; cilia on ciliated cells move the mucus toward the throat, where it can be swallowed or expelled, protecting lower airways.
What to do in an assessment
- For ventilation, state movement → thoracic volume change → pressure change → air direction. Avoid reversing the pressure relationship: air moves from higher external pressure to lower internal pressure.
- In a protection question, distinguish the jobs: goblet cells produce mucus, mucus traps particles/pathogens, cilia move it away from the lungs.
In plain language
Rib and diaphragm movements change thoracic pressure to ventilate the lungs; mucus and cilia help keep particles out.
Self-check
During inspiration, what happens to thoracic volume and pressure, and how does that make air enter?
Show the answer
Thoracic volume increases and pressure inside falls below atmospheric pressure. Air therefore moves into the lungs down the pressure gradient.
View diagrams
Human breathing systemSimplified schematic; not to scale. - A
- B
- C
- D
- E
- F
- G
- H
- I
- J
- K
Show labelled key: Answer key for breathing-system
Human breathing systemSimplified schematic; not to scale. - ALarynx
- BTrachea
- CBronchi
- DBronchioles
- EAlveoli
- FCapillaries
- GLung
- HRibs
- IIntercostal muscles
- JDiaphragm
- KNasal cavity
Intercostal muscles between two ribsSimplified schematic; not to scale. - A
- B
- C
- D
- E
- F
Show labelled key: Answer key for intercostal-muscles
Intercostal muscles between two ribsSimplified schematic; not to scale. - ARib above
- BRib below
- CExternal intercostal: fibres down and forwards
- DInternal intercostal: fibres down and backwards
- ESternum (front)
- FVertebra (back)
Identify airway, lungs, alveolus/capillary and diaphragm structures, then distinguish internal and external intercostal muscles in section.
Topic group
Respiration
- Course content
Scope: Course content · Subject-content route: any of Core, Extended (Core and Supplement) · §3, Topic 12, §§12.1–12.3, Core outcomes 1–2; 12.2 outcomes 1–2; 12.3 outcomes 1–4.
Open revision guidance
What to know
- Respiration is a chemical process in cells that releases energy for muscle contraction, protein synthesis, cell division, active transport, growth, nerve impulses and maintenance of a constant body temperature. Do not use 'respiration' as a synonym for breathing: breathing ventilates lungs; respiration is a cellular process.
- Aerobic respiration uses oxygen to break down nutrient molecules: glucose + oxygen → carbon dioxide + water. Anaerobic respiration breaks down nutrient molecules without oxygen and releases much less energy per glucose molecule. In yeast: glucose → alcohol + carbon dioxide; in muscles during vigorous exercise: glucose → lactic acid.
- To test temperature's effect on yeast respiration, mix equal yeast and glucose volumes, equilibrate replicate mixtures at different water-bath temperatures, keep pH, substrate concentration and total volume constant, and measure carbon dioxide produced in a fixed time (for example, gas-syringe volume). Use a control and repeats; compare mean rate, not unequal durations. Worked dataset (simulated means of three repeats; CO₂ volume in five minutes): 20°C = 5 cm³, 30°C = 13 cm³, 40°C = 8 cm³; a glucose-only no-yeast blank = 0 cm³. The example shows increased rate from 20°C to 30°C and a lower result at 40°C under these conditions; do not assume a universal optimum from three points. Use warm, not boiling, water, eye protection and a freely moving gas syringe; teacher demonstration or supplied data avoids unsafe handling.
What to do in an assessment
- In an equation question, select the correct pathway and organism/tissue before writing products. Include oxygen as a reactant only in the aerobic word equation.
- In a temperature experiment, identify temperature as the independent variable and CO2 volume per unit time as the dependent variable; state controls, repeats and a safety step for warm water/glassware.
In plain language
Cells release energy by respiration; aerobic respiration uses oxygen, while anaerobic pathways release less energy and have different products.
Self-check
Write the Core word equation for anaerobic respiration in yeast, then state one difference from aerobic respiration.
Show the answer
Glucose → alcohol + carbon dioxide. It occurs without oxygen and releases much less energy per glucose molecule than aerobic respiration.
- Course content
Scope: Course content · Subject-content route: Extended (Core and Supplement) · §3, Topic 12, §12.2 Supplement outcome 3; §12.3 Supplement outcomes 5–7(a)–(c).
Open revision guidance
What to know
- Balance the aerobic equation by atom counts: C6H12O6 + 6O2 → 6CO2 + 6H2O. For yeast anaerobic respiration, C6H12O6 → 2C2H5OH + 2CO2. Check C, H and O on each side; do not change formula subscripts to balance an equation.
- During vigorous exercise, lactic acid builds up in muscles and blood, creating an oxygen debt. After exercise, heart rate stays high to transport lactic acid from muscles to liver; breathing stays faster and deeper to supply oxygen; lactic acid is aerobically respired in the liver. Link each prolonged response to debt removal rather than saying oxygen directly 'removes' lactic acid.
What to do in an assessment
- Balance each equation by making a short atom-count table for both sides, adjust whole-number coefficients only, then recount every element.
- For oxygen debt, use the order: lactic acid build-up → sustained circulation and ventilation → oxygen delivery to liver → aerobic respiration of lactic acid.
In plain language
Balanced equations conserve atoms, and continued breathing and circulation after exercise supply the oxygen needed to respire lactic acid.
Self-check
How does the body help remove oxygen debt after vigorous exercise?
Show the answer
Heart rate remains high to carry lactic acid in blood from muscles to the liver, while deeper and faster breathing supplies oxygen; the liver aerobically respires the lactic acid.
Topic group
Excretion in humans
- Course content
Scope: Course content · Subject-content route: any of Core, Extended (Core and Supplement) · §3, Topic 13, §13.1, Core outcomes 1–3.
Open revision guidance
What to know
- Excretion removes metabolic waste. Carbon dioxide leaves through the lungs. Kidneys excrete urea plus excess water and ions in urine. Identify the urinary route on a body diagram: paired kidneys produce urine, ureters carry it to the bladder for storage, and the urethra carries it out of the body. Ureters and urethra are not interchangeable.
- Urea is a metabolic waste, not simply undigested protein; its liver formation from excess amino acids belongs to Supplement. For a labelled-system question, follow each tube from its organ of origin and state direction of movement.
What to do in an assessment
- Separate excretion from egestion: match a waste product to the organ that removes it. On a urinary-system diagram, locate organs first, then trace urine from kidney → ureter → bladder → urethra.
In plain language
The lungs remove carbon dioxide, and kidneys remove urea and excess water/ions in urine.
Self-check
A label points to the tube carrying urine from a kidney to the bladder. What is it, and which route does urine then follow?
Show the answer
It is a ureter. Urine passes to the bladder, where it is stored, and leaves through the urethra.
View diagrams
Human urinary systemSimplified schematic; not to scale. Blood flow: heart → aorta → renal arteries → kidneys → renal veins → vena cava → heart. - A
- B
- C
- D
- E
- F
- G
- H
- I
Show labelled key: Answer key for urinary-system
Human urinary systemSimplified schematic; not to scale. Blood flow: heart → aorta → renal arteries → kidneys → renal veins → vena cava → heart. - AKidney
- BUreter
- CUrinary bladder
- DUrethra
- EKidney
- FAorta
- GVena cava
- HRenal arteries
- IRenal veins
Section through a kidneySimplified schematic; not to scale. - A
- B
- C
- D
- E
- F
Show labelled key: Answer key for kidney-section
Section through a kidneySimplified schematic; not to scale. - ARenal cortex
- BRenal medulla
- CRenal pelvis
- DUreter
- ERenal artery
- FRenal vein
Trace urine-flow structures on the urinary-system diagram and identify cortex/medulla on the keyed kidney section. - Course content
Scope: Course content · Subject-content route: Extended (Core and Supplement) · §3, Topic 13, §13.1, Supplement outcomes 4–9, including outcome 5(a)–(c).
Open revision guidance
What to know
- The kidney has an outer cortex and inner medulla. A nephron and its associated blood vessels filter and selectively reabsorb. At the glomerulus, water, glucose, urea and ions are filtered from blood. The nephron returns all glucose, some ions and most water to blood. Urine therefore contains urea, excess water and excess ions; the syllabus does not require microscopic process details.
- The liver assimilates amino acids by converting them into proteins. When amino acids are in excess, the liver removes their nitrogen-containing part (deamination) and forms urea. Urea is a metabolic waste and toxic if it accumulates, so excretion is important. Keep the sequence distinct: amino acids → deamination in liver → urea → transport in blood → kidney excretion.
What to do in an assessment
- In a nephron flow question, distinguish what is filtered from what is reabsorbed and what remains in urine. Use the exact quantities: all glucose, some ions, most water return to blood; urea and excess water/ions remain in urine.
- For amino-acid metabolism, connect protein assimilation with excess-amino-acid deamination, then explain why toxic urea must be removed. No extra biochemical detail is needed.
In plain language
The nephron filters blood and returns useful materials; the liver converts excess amino-acid nitrogen to toxic urea, which the kidneys excrete.
Self-check
Glucose is filtered at the glomerulus. Why should it normally not be present in urine, and what substances are expected to remain?
Show the answer
All filtered glucose is reabsorbed back into the blood by the nephron. Urine contains urea, excess water and excess ions.
View diagrams
Human urinary systemSimplified schematic; not to scale. Blood flow: heart → aorta → renal arteries → kidneys → renal veins → vena cava → heart. - A
- B
- C
- D
- E
- F
- G
- H
- I
Show labelled key: Answer key for urinary-system
Human urinary systemSimplified schematic; not to scale. Blood flow: heart → aorta → renal arteries → kidneys → renal veins → vena cava → heart. - AKidney
- BUreter
- CUrinary bladder
- DUrethra
- EKidney
- FAorta
- GVena cava
- HRenal arteries
- IRenal veins
Section through a kidneySimplified schematic; not to scale. - A
- B
- C
- D
- E
- F
Show labelled key: Answer key for kidney-section
Section through a kidneySimplified schematic; not to scale. - ARenal cortex
- BRenal medulla
- CRenal pelvis
- DUreter
- ERenal artery
- FRenal vein
Trace urine-flow structures on the urinary-system diagram and identify cortex/medulla on the keyed kidney section.
Topic group
Coordination and response
- Course content
Scope: Course content · Subject-content route: any of Core, Extended (Core and Supplement) · §3, Topic 14, §§14.1–14.5, Core outcomes 14.1 1–7 (including 2(a)–(b)); 14.2 1–4 (including 3(a)–(e)); 14.3 1–4 (including 2(a)–(d), 3(a)–(c)); 14.4 1–2; 14.5 1–3.
Open revision guidance
What to know
- Electrical impulses travel along neurones. The CNS is the brain and spinal cord; the PNS is nerves outside them. The nervous system coordinates and regulates body functions. A simple reflex route is stimulus → receptor → sensory neurone → relay neurone in CNS → motor neurone → effector (muscle or gland). A reflex is rapid and automatic, integrating a stimulus with an effector response. A synapse is the junction between two neurones.
- Sense organs contain receptor-cell groups responsive to specific stimuli: light, sound, touch, temperature and chemicals. The eye's cornea refracts light; iris controls light entering through the pupil; lens focuses light on retina; retina contains light receptors, some sensitive to different colours; optic nerve carries impulses to brain. Blind spot is where the optic nerve leaves the eye. Bright light reduces pupil diameter; dim light increases it.
- A hormone is a chemical made by a gland, carried in blood, that changes activity of one or more specific target organs. Adrenal glands secrete adrenaline, pancreas insulin, testes testosterone and ovaries oestrogen. Adrenaline is secreted in fight-or-flight situations and increases breathing rate, heart rate and pupil diameter. Nervous control is faster and typically shorter-lived than hormonal control.
- Homeostasis maintains a constant internal environment. Insulin decreases blood glucose concentration. In plants, gravitropism is growth toward/away from gravity and phototropism is growth toward/away from the direction of light. To investigate shoot/root responses, place germinating seedlings in controlled orientations and light directions, include an upright/directional control, keep water and temperature constant, and record growth direction over time. Worked tropism investigation: place comparable germinating seedlings horizontally in moist covered trays in darkness to test gravity, and place upright seedlings in boxes with one side aperture to test directional light; use upright and diffuse-light controls, equal seed age, moisture, temperature and time. After 24 hours, illustrative means for five seedlings are: horizontal/dark shoots curve 60° upward and roots 50° downward; side-lit shoots curve 35° toward light and roots 20° away; controls remain nearly straight. Record angle/direction from a fixed starting axis. Use clean seeds and trays, wash hands and discard growth safely; teacher-supplied images/data are suitable.
What to do in an assessment
- For reflex-arc questions, order the five components and make clear that the receptor detects the stimulus and the effector produces the response. For nervous/hormonal comparisons, name speed and duration rather than claiming one system has no effect.
- For tropism practical questions, state orientation/light as the changed condition, growth direction or angle as the response, and constant water, temperature and time. Use the specific stimulus in the conclusion.
In plain language
Nerves and hormones coordinate body responses; homeostasis keeps internal conditions stable, and plants direct growth in response to gravity and light.
Self-check
A person touches a hot surface and rapidly withdraws a hand. Put the reflex pathway in order and identify the effector.
Show the answer
Receptor → sensory neurone → relay neurone in the CNS → motor neurone → effector. The hand muscle is the effector that contracts to withdraw the hand.
View diagrams
Sensory, relay and motor neuronesSimplified schematic; not to scale. - A
- B
- C
- D
- E
- F
Show labelled key: Answer key for neurone-types
Sensory, relay and motor neuronesSimplified schematic; not to scale. - ASensory neurone
- BCell body
- CRelay neurone
- DMotor neurone
- EDendrites
- FAxon
Section through the human eyeSimplified schematic; not to scale. - A
- B
- C
- D
- E
- F
- G
- H
- I
- J
Show labelled key: Answer key for eye-section
Section through the human eyeSimplified schematic; not to scale. - ACornea
- BIris
- CPupil
- DLens
- ERetina
- FOptic nerve
- GBlind spot
- HFovea
- ISclera
- JChoroid
Selected endocrine glandsOvaries and testes are shown in separate anatomical examples. Simplified schematic; not to scale. - A
- B
- C
- D
Show labelled key: Answer key for endocrine-glands
Selected endocrine glandsOvaries and testes are shown in separate anatomical examples. Simplified schematic; not to scale. - AAdrenal glands
- BPancreas
- CTestes
- DOvaries
Section through human skinSimplified schematic; not to scale. - A
- B
- C
- D
- E
- F
- G
- H
- I
Show labelled key: Answer key for skin-section
Section through human skinSimplified schematic; not to scale. - AHair
- BErector muscle
- CSweat gland
- DReceptor
- ESensory neurone
- FBlood vessels
- GFatty tissue
- HSweat duct
- ISweat pore
Practise distinguishing neurone types, eye anatomy, endocrine-gland locations and skin thermoregulation structures with keyed views. - Course content
Scope: Course content · Subject-content route: Extended (Core and Supplement) · §3, Topic 14, §§14.1–14.5, Supplement outcomes 14.1 8–10 (including 9(a)–(d)); 14.2 5–9 (including 8(a)–(b)); 14.3 5–6(a)–(b); 14.4 3–8; 14.5 4–5(a)–(d).
Open revision guidance
What to know
- A synapse contains vesicles of neurotransmitter in one neurone, a synaptic gap and receptor proteins on the next. An arriving impulse triggers neurotransmitter release; molecules diffuse across the gap and bind complementary receptors, stimulating an impulse in the next neurone. Because release occurs from vesicles on one side and receptors are on the next, transmission is one-way.
- Pupil reflex uses antagonistic circular and radial iris muscles: in bright light circular muscles contract and radial relax, constricting the pupil; in dim light radial muscles contract and circular relax, dilating it. For accommodation, near objects require ciliary muscles to contract, suspensory ligaments to slacken and the lens to become thicker/more convex, increasing refraction; distant focus uses relaxed ciliary muscles, taut ligaments and a thinner lens with less refraction. Rods are concentrated toward the peripheral retina and absent from the fovea; cones are most concentrated at the fovea. Rods are more sensitive for night vision, while three cone types absorb different colours for colour vision. The fovea is the central retinal region with greatest visual acuity.
- Glucagon is secreted by the pancreas. In blood-glucose control, insulin promotes uptake/storage of glucose and lowers blood glucose; glucagon prompts the liver to release glucose, raising it. Negative feedback reverses deviation from a set point: a rise elicits a response that lowers the variable, and a fall elicits a response that raises it. Type 1 diabetes treatment includes insulin, with dose, food and activity managed to control blood glucose. Skin temperature responses include hairs and erector muscles, sweat glands, receptors, sensory neurones, blood vessels and fatty tissue; sweating cools by evaporation, shivering produces heat, insulation limits heat loss, and the brain coordinates responses. Vasodilation increases blood flow through surface capillaries for heat loss; vasoconstriction reduces it.
- Shoots show positive phototropism and negative gravitropism; roots commonly show positive gravitropism. These are chemical growth responses. Auxin is made in the shoot tip and diffuses through the plant; light and gravity cause unequal auxin distribution. In a shoot, higher auxin on the shaded/lower side stimulates greater cell elongation there, bending the shoot toward light or upward against gravity.
What to do in an assessment
- For synapse sequencing, use release → diffusion → receptor binding → next impulse, then explain one-way flow from the locations of vesicles and receptors.
- For eye questions, state both muscle/ligament changes and lens shape before explaining refraction. For homeostasis, name the set point, direction of change and a response that reverses it; for temperature, distinguish heat production, insulation and heat transfer at skin.
- For a tropism explanation, identify stimulus and auxin distribution first, then compare cell elongation on opposite sides and infer the bend direction. Do not say auxin makes all shoot cells elongate equally.
In plain language
Signals cross synapses in one direction, eyes adjust focus and light entry, hormones and skin responses maintain internal conditions, and auxin steers plant growth.
Self-check
In bright light, which iris muscle contracts, what happens to pupil diameter, and why does a shoot bend toward a one-sided light source?
Show the answer
Circular iris muscles contract, decreasing pupil diameter. Auxin becomes more concentrated on the shaded side of the shoot, where it stimulates more cell elongation; that side grows longer and the shoot bends toward the light.
View diagrams
Sensory, relay and motor neuronesSimplified schematic; not to scale. - A
- B
- C
- D
- E
- F
Show labelled key: Answer key for neurone-types
Sensory, relay and motor neuronesSimplified schematic; not to scale. - ASensory neurone
- BCell body
- CRelay neurone
- DMotor neurone
- EDendrites
- FAxon
Section through the human eyeSimplified schematic; not to scale. - A
- B
- C
- D
- E
- F
- G
- H
- I
- J
Show labelled key: Answer key for eye-section
Section through the human eyeSimplified schematic; not to scale. - ACornea
- BIris
- CPupil
- DLens
- ERetina
- FOptic nerve
- GBlind spot
- HFovea
- ISclera
- JChoroid
Selected endocrine glandsOvaries and testes are shown in separate anatomical examples. Simplified schematic; not to scale. - A
- B
- C
- D
Show labelled key: Answer key for endocrine-glands
Selected endocrine glandsOvaries and testes are shown in separate anatomical examples. Simplified schematic; not to scale. - AAdrenal glands
- BPancreas
- CTestes
- DOvaries
Section through human skinSimplified schematic; not to scale. - A
- B
- C
- D
- E
- F
- G
- H
- I
Show labelled key: Answer key for skin-section
Section through human skinSimplified schematic; not to scale. - AHair
- BErector muscle
- CSweat gland
- DReceptor
- ESensory neurone
- FBlood vessels
- GFatty tissue
- HSweat duct
- ISweat pore
Practise distinguishing neurone types, eye anatomy, endocrine-gland locations and skin thermoregulation structures with keyed views.
Topic group
Topic 15 Core
- Course content
Scope: Course content · Subject-content route: any of Core, Extended (Core and Supplement) · Practical examination: any of Paper 5: Practical Test, Paper 6: Alternative to Practical · §3 Topic 15 Drugs: §15.1 Core 1; §15.1 Core 2; §15.1 Core 3; §15.1 Core 4
Open revision guidance
What to know
- A drug is any substance taken into the body that modifies or affects chemical reactions. Antibiotics are used to treat bacterial infections: they kill bacteria or prevent their growth, but they do not affect viruses, whose replication takes place inside host cells. Antibiotics therefore do not treat a cold caused by a virus.
- Some bacteria already carry variation that makes them resistant. If an antibiotic is used, susceptible bacteria die while resistant bacteria survive, reproduce and pass resistance on; the resistant fraction can grow, making the antibiotic less effective. Antibiotic resistance is selection of bacteria, not an individual bacterium choosing to adapt.
What to do in an assessment
- For a treatment question, identify whether the pathogen is bacterial or viral before choosing an antibiotic. For a resistance explanation, link pre-existing variation → differential survival during treatment → reproduction/inheritance → increased frequency of resistance.
In plain language
Antibiotics work against bacteria, not viruses; overuse gives resistant bacteria a survival advantage.
Self-check
A student takes antibiotics for influenza and stops a later course as soon as symptoms improve. Explain two problems.
Show the answer
Influenza is caused by a virus, so an antibiotic will not treat it. Stopping early may leave bacteria that were less susceptible alive; they can reproduce and pass on resistance, increasing the chance that a resistant population develops.
Topic group
Topic 15 Supplement
- Course content
Scope: Course content · Subject-content route: Extended (Core and Supplement) · Practical examination: any of Paper 5: Practical Test, Paper 6: Alternative to Practical · §3 Topic 15 Drugs: §15.1 Supplement 5
Open revision guidance
What to know
- Use antibiotics only when essential and as directed. Avoiding unnecessary courses reduces the number of occasions on which susceptible bacteria are removed and resistant variants are favoured. This slows selection for resistant strains such as MRSA; it does not guarantee that resistance will never arise.
- In an exam, distinguish the cause of resistance (random genetic variation/mutation) from the selective agent (antibiotic exposure). The medicine does not make a bacterium deliberately change; survivors reproduce and transmit resistance.
What to do in an assessment
- Write the causal chain explicitly: unnecessary exposure → susceptible bacteria die → resistant bacteria survive → resistant bacteria reproduce and pass resistance alleles → proportion resistant rises. State that responsible use limits selection rather than instantly removing existing resistance.
In plain language
Using antibiotics only when necessary reduces the selective advantage given to resistant bacteria.
Self-check
In a bacterial population, 2 of 100 bacteria are resistant before treatment. Why can unnecessary antibiotic use increase the proportion resistant?
Show the answer
The antibiotic kills susceptible bacteria more readily; the 2 resistant bacteria are more likely to survive, reproduce and pass resistance on. If unnecessary courses repeatedly impose this selection, resistant descendants make up a larger proportion, even if the antibiotic did not cause those bacteria to choose resistance.
Topic group
Topic 16 Core
- Course content
Scope: Course content · Subject-content route: any of Core, Extended (Core and Supplement) · Practical examination: any of Paper 5: Practical Test, Paper 6: Alternative to Practical · §3 Topic 16 Reproduction: §16.1 Core 1; §16.1 Core 2; §16.2 Core 1; §16.2 Core 2; §16.3 Core 1; §16.3 Core 2; §16.3 Core 3; §16.3 Core 4; §16.3 Core 5; §16.3 Core 6; §16.3 Core 7; §16.3 Core 8; §16.4 Core 1; §16.4 Core 2; §16.4 Core 3; §16.4 Core 4; §16.4 Core 5; §16.4 Core 6; §16.4 Core 7; §16.4 Core 8; §16.5 Core 1; §16.5 Core 2; §16.6 Core 1; §16.6 Core 2; §16.6 Core 3; §16.6 Core 4; §16.6 Core 5
Open revision guidance
What to know
- Asexual reproduction uses one parent and produces genetically identical offspring (clones); examples include strawberry runners, potato tubers and binary fission in bacteria. Recognise asexual examples in a description or image by one-parent reproduction without fusion of gamete nuclei; it is fast and can preserve a successful genotype, but a uniform population has little variation if conditions change. For crops it can reliably multiply desired plants quickly, but disease or environmental change may affect many clones. Sexual reproduction fuses nuclei of two gametes at fertilisation to form a zygote; offspring are genetically different. Its variation can improve a wild population’s response to change, but finding mates and producing gametes costs time/resources; uniform crop traits may be harder to maintain. Gamete nuclei are haploid; the zygote nucleus is diploid.
- Flower structure and function: sepals protect the bud; petals often attract pollinators; a stamen consists of filament supporting anther, which makes pollen; a carpel includes stigma (receives pollen), style (route toward ovary), ovary (contains ovules), and ovules (contain female nuclei). Wind-pollinated flowers typically have exposed dangling anthers, large feathery exposed stigmas and numerous small/light pollen; insect-pollinated flowers commonly have anthers inside, sticky stigmas and larger/spiky or sticky pollen. Pollination is anther-to-stigma transfer. Fertilisation occurs when the pollen nucleus fuses with a nucleus in an ovule. Insect-pollinated flowers commonly have conspicuous petals, scent/nectar and pollen that adheres to animals; wind-pollinated flowers expose anthers/stigmas and release abundant light pollen. These are contrasting patterns, not universal rules for every species.
- Seed germination requires water, oxygen and a suitable temperature. To investigate one condition, place equal numbers of similar seeds on identical moist supports; vary only the chosen factor (for example, water present/absent), keep seed type, number, temperature and observation period controlled, use replicates, and record the number germinating at regular times. To test oxygen, compare aerated moist support with a waterlogged/oxygen-limited treatment; to test temperature, use otherwise identical sets at measured temperatures. Do not change water, oxygen and temperature together.
- Human reproduction: testes produce sperm; scrotum holds testes outside the body; sperm ducts carry sperm; prostate adds fluid; urethra carries urine or semen out (not simultaneously); penis transfers semen. Ovaries produce egg cells and sex hormones; oviducts carry eggs and are usual fertilisation sites; uterus supports embryo/fetus development; cervix is the narrow opening to the uterus; vagina receives penis/semen and is the birth canal. Sperm’s flagellum enables movement, mitochondria release energy for movement and acrosome enzymes help penetrate egg coverings. An egg is larger, non-motile, has energy stores and a jelly coat that changes at fertilisation to reduce entry of additional sperm. Sperm are small and produced in large numbers; eggs are large and released in much smaller numbers. Fertilisation fuses sperm and egg nuclei; the zygote divides to form an embryo, a ball of cells that implants in the uterine lining. The umbilical cord connects fetus and placenta; placenta enables dissolved nutrients, gases and excretory products to exchange between maternal and fetal blood without their blood mixing; amniotic sac/fluid surround and cushion the fetus.
- During puberty, testosterone and oestrogen promote development and regulation of secondary sexual characteristics. In the menstrual cycle, FSH stimulates an ovarian follicle/egg to mature and oestrogen production; oestrogen rebuilds the uterine lining. A high oestrogen level triggers an LH surge, which causes ovulation. The emptied follicle forms a corpus luteum that secretes progesterone; progesterone maintains the uterine lining and suppresses FSH/LH so another egg does not mature immediately. If pregnancy does not occur, progesterone and oestrogen fall and the lining is shed. In pregnancy, progesterone (initially corpus luteum, later placenta) and oestrogen from the placenta help maintain the lining. An STI is transmitted through sexual contact. HIV is a pathogen that causes an STI and may lead to AIDS; it can pass in infected blood/sexual fluids and from mother to child. It is not transmitted by ordinary social contact. STI spread can be reduced by condoms, testing and prompt treatment, informing partners, and avoiding sexual contact while infectious.
- Worked source-style identification schematics (text-only, not to scale): for an insect-pollinated flower trace the central carpel as stigma → style → ovary (containing ovules); each stamen is an anther (pollen) supported by a filament; petals surround the reproductive parts and sepals sit at the base. In a wind-pollinated specimen, identify exposed dangling anthers and a large feathery stigma; compare its small/light pollen with the larger/stickier or spiky pollen associated with insect transport. Drawing method: outline the overall flower proportion, place ovary at the base of the carpel, connect style to stigma, add anthers on filaments, then petals and sepals; use fine unshaded outlines and label lines. Use the attached flower-structure and pollination-comparison practice views and closed keys alongside the source-required drawing conventions.
- Worked human-system schematic cues (text-only, not to scale): male sperm route = testes (inside scrotum) → sperm ducts → prostate adds fluid → urethra → penis; female egg route = ovaries → oviducts → uterus → cervix → vagina. Fetus/placenta diagram cue = fetus — umbilical cord — placenta; fetus lies inside amniotic sac, with amniotic fluid around it. A label at the narrow passage between uterus and vagina is the cervix; a label on the tube from ovary toward uterus is the oviduct. Placenta exchanges dissolved nutrients, gases and excretory products while maternal and fetal blood remain separate. Use the attached male/female reproductive-system and fetal-support practice views, then check the keyed anatomical relationships.
What to do in an assessment
- For comparisons, organise by parent number, genetic similarity, gamete fusion and offspring variation; then weigh the consequences for wild populations versus uniform crop production. For plant structure questions, link each named part to its function. In a germination experiment, state the independent variable, measured germination, controlled conditions, repeats and how results are recorded. For hormone-cycle questions, use FSH → follicle/oestrogen → LH surge/ovulation → corpus luteum/progesterone → maintained lining; explain the hormone fall and menstruation if no pregnancy. For STI control, pair a transmission route with a prevention measure.
In plain language
Reproduction can clone one successful parent or combine gametes to create variation; plant and human structures support fertilisation and development.
Self-check
In a germination test, 20 seeds are placed on moist cotton at 20 °C, while 20 seeds are placed on dry cotton at 20 °C. What is changed, what must be kept constant, and what result should be counted?
Show the answer
Water availability is the independent variable. Keep seed species/age, number, temperature, light and observation period the same; use replicates if possible. Count the number of seeds that germinate in each group at the same time intervals, rather than judging growth from unequal samples.
View diagrams
Asexual reproduction: potato tuber. A new potato plant grows from a bud on a parent tuber. One parent is shown; no gamete fusion is depicted. Simplified schematic, not to scale. Use genuine photomicrographs separately where specimen recognition is required.
Show labelled key: Answer key for asexual-example
Asexual reproduction: potato tuber. A new potato plant grows from a bud on a parent tuber. One parent is shown; no gamete fusion is depicted. - Parent potato tuber / Cloron tatws rhiant
- Bud (eye) / blaguryn (llygad)
- New shoot / eginyn newydd
- New tuber / cloron newydd
Simplified schematic, not to scale. Use genuine photomicrographs separately where specimen recognition is required.
Flower structure. Simplified flower showing the stamen and carpel structures, petals and sepals. Simplified schematic, not to scale. Use genuine photomicrographs separately where specimen recognition is required.
Show labelled key: Answer key for flower-structure
Flower structure. Simplified flower showing the stamen and carpel structures, petals and sepals. - Anther / Blwrïan
- Filament / Ffilament
- Stigma / Stigma
- Style / Arddull
- Ovary / Ofari
- Ovule / Ofwl
- Petal / Petal
- Sepal / Sepal
Simplified schematic, not to scale. Use genuine photomicrographs separately where specimen recognition is required.
Typical pollination adaptations. A comparison of typical wind-pollinated and insect-pollinated flower features and pollen. Patterns vary among species. Simplified schematic, not to scale. Use genuine photomicrographs separately where specimen recognition is required.
Show labelled key: Answer key for pollination-comparison
Typical pollination adaptations. A comparison of typical wind-pollinated and insect-pollinated flower features and pollen. Patterns vary among species. - Exposed, dangling anthers / Blwrïau agored, yn hongian
- Feathery exposed stigma / Stigma pluog agored
- Small, light pollen grains / Grawn paill bach, ysgafn
- Anthers within the flower / Blwrïau o fewn y blodyn
- Sticky stigma / Stigma gludiog
- Larger, sticky or spiky pollen / Paill mwy, gludiog neu bigog
Simplified schematic, not to scale. Use genuine photomicrographs separately where specimen recognition is required.
Male reproductive system. Simplified schematic showing testes held in the scrotum, sperm ducts, prostate, urethra and penis. Anatomical orientation is front-facing. Simplified schematic, not to scale. Use genuine photomicrographs separately where specimen recognition is required.
Show labelled key: Answer key for male-reproduction
Male reproductive system. Simplified schematic showing testes held in the scrotum, sperm ducts, prostate, urethra and penis. Anatomical orientation is front-facing. - Sperm duct / Sberm-ddwythell
- Prostate gland / Chwarren brostad
- Urethra / Wrethra
- Penis / Pidyn
- Testis / Ceilliau
- Scrotum / Ceillgwd
Simplified schematic, not to scale. Use genuine photomicrographs separately where specimen recognition is required.
Female reproductive system. Simplified front-facing schematic showing ovaries, oviducts, uterus, cervix and vagina. Simplified schematic, not to scale. Use genuine photomicrographs separately where specimen recognition is required.
Show labelled key: Answer key for female-reproduction
Female reproductive system. Simplified front-facing schematic showing ovaries, oviducts, uterus, cervix and vagina. - Ovary / Ofari
- Oviduct / Dwythell wy
- Uterus / Croth
- Cervix / Ceg y groth
- Vagina / Fagina
Simplified schematic, not to scale. Use genuine photomicrographs separately where specimen recognition is required.
Fetus and supporting structures. Simplified schematic showing fetus, placenta, umbilical cord, amniotic sac and amniotic fluid. Maternal and fetal blood remain separate; this diagram does not show blood mixing. Simplified schematic, not to scale. Use genuine photomicrographs separately where specimen recognition is required.
Show labelled key: Answer key for fetal-support
Fetus and supporting structures. Simplified schematic showing fetus, placenta, umbilical cord, amniotic sac and amniotic fluid. Maternal and fetal blood remain separate; this diagram does not show blood mixing. - Placenta / Brych
- Umbilical cord / Llinyn bogail
- Amniotic sac / Sach amniotig
- Amniotic fluid / Hylif amniotig
- Fetus / Ffetws
Simplified schematic, not to scale. Use genuine photomicrographs separately where specimen recognition is required.
Practise source-listed reproductive structures, flower/pollen comparisons, pollination, human reproductive systems and fetal-support structures with matching keys.
Topic group
Topic 16 Supplement
- Course content
Scope: Course content · Subject-content route: Extended (Core and Supplement) · Practical examination: any of Paper 5: Practical Test, Paper 6: Alternative to Practical · §3 Topic 16 Reproduction: §16.1 Supplement 3; §16.2 Supplement 3; §16.2 Supplement 4; §16.3 Supplement 9; §16.3 Supplement 10; §16.3 Supplement 11; §16.3 Supplement 12; §16.4 Supplement 9; §16.4 Supplement 10; §16.5 Supplement 3; §16.5 Supplement 4
Open revision guidance
What to know
- Pollination routes: self-pollination transfers pollen from a flower’s anther to the stigma of the same flower or another flower on that plant; cross-pollination transfers it to a flower on another plant of the same species. Selfing can preserve successful combinations and reduce reliance on pollinators, but tends to produce less genetic variation and can reduce a population’s ability to respond to change. Cross-pollination generally increases variation and potential resilience, but may depend more on pollinators and brings pollen from another plant. After compatible pollen lands on a stigma it germinates; a pollen tube grows down the style and enters an ovule, carrying a nucleus that fuses with the ovule nucleus. Endosperm/developmental details are not needed.
- The placenta and umbilical cord support exchange of dissolved nutrients, gases and excretory products between maternal and fetal blood; maternal and fetal blood remain separate. Some pathogens and toxins can cross the placenta and harm the fetus.
- In the menstrual cycle, FSH supports follicle development and oestrogen production; oestrogen rebuilds the uterine lining and at a high level triggers LH release. LH causes ovulation. Progesterone, produced by the corpus luteum after ovulation, maintains the lining and inhibits FSH/LH. If there is no pregnancy, progesterone falls and menstruation follows; in pregnancy, the placenta produces oestrogen and progesterone to maintain conditions for the embryo/fetus. During early pregnancy the corpus luteum supplies progesterone before placental production takes over.
What to do in an assessment
- When comparing self- and cross-pollination, separate genetic variation, resilience to environmental change and dependence on pollinators. In a fertilisation sequence, place pollen transfer first, then pollen tube growth to the ovule, then fusion of nuclei. For hormones, explain what changes in the ovary and uterus and connect each change to FSH, LH, oestrogen or progesterone.
In plain language
Pollen tubes deliver a male nucleus to an ovule; cycle hormones coordinate ovulation and maintain the uterine lining.
Self-check
A plant’s pollen reaches a stigma on another plant of the same species. Name the pollination type and describe what must happen next for fertilisation.
Show the answer
It is cross-pollination. The pollen grain germinates on the stigma, a pollen tube grows down to and enters an ovule, and the pollen nucleus fuses with a nucleus in that ovule.
Topic group
Topic 17 Core
- Course content
Scope: Course content · Subject-content route: any of Core, Extended (Core and Supplement) · Practical examination: any of Paper 5: Practical Test, Paper 6: Alternative to Practical · §3 Topic 17 Inheritance: §17.1 Core 1; §17.1 Core 2; §17.1 Core 3; §17.1 Core 4; §17.4 Core 1; §17.4 Core 2; §17.4 Core 3; §17.4 Core 4; §17.4 Core 5; §17.4 Core 6; §17.4 Core 7; §17.4 Core 8; §17.4 Core 9; §17.4 Core 10; §17.4 Core 11; §17.4 Core 12
Open revision guidance
What to know
- Chromosomes are made of DNA, which carries genetic information in genes; a gene is a length of DNA that codes for a protein, and an allele is an alternative form of a gene. In humans, females are usually XX and males XY: an egg contributes X, while sperm contribute X or Y, so the sperm chromosome determines the child’s chromosomal sex. A genetic cross predicts possibilities, not a guaranteed outcome for each family.
- Inheritance is transmission of genetic information between generations. Genotype is an organism’s allele combination; phenotype is its observable characteristic. Homozygous means two identical alleles and true-breeding homozygotes crossed together breed true; heterozygous means two different alleles and is not pure-breeding. A dominant allele is expressed when present; a recessive phenotype appears only when no dominant allele is present.
- Worked Punnett method (use B for dominant brown seeds, b for recessive green): write the parents’ genotypes, list each parent’s gametes, place one parent’s gametes along the top and the other’s down the side, combine one allele from each in each cell, then count genotypes and phenotypes. For Bb × Bb: gametes B,b and B,b produce BB, Bb, Bb, bb. Genotype ratio is 1 BB : 2 Bb : 1 bb; phenotype ratio is 3 brown : 1 green. For Bb × bb, offspring are Bb, Bb, bb, bb, so the phenotype ratio is 1 dominant : 1 recessive. A ratio is an expected probability across many offspring, not an exact promise for a small family.
- Worked monohybrid diagram (rows are one parent’s gametes; columns are the other’s): cross Bb × Bb; gametes B,b and B,b. Grid: top headings B | b; row B gives BB | Bb; row b gives Bb | bb. Count 1 BB : 2 Bb : 1 bb and, if B is dominant, 3 dominant : 1 recessive. A separate worked pedigree schematic: Generation I unaffected father □—○ unaffected mother; their Generation II children are ○ unaffected and ● affected (□ male, ○ female, filled = affected). If the named condition is recessive, the affected daughter is aa; each unaffected parent must have supplied a, so both are carriers Aa. Use the worked symbol key as a text-based pedigree exercise; when a pedigree stimulus is supplied, trace the stated characteristic through each generation and justify genotype inferences from relatives.
What to do in an assessment
- Show parent genotypes → gametes → completed allele combinations → genotype ratio → phenotype ratio. Keep genotype symbols consistent and state which allele is dominant. In pedigree tasks, trace the specified characteristic generation by generation and support an inference with affected/unaffected relatives; the text-symbol case provides a worked inference pattern; apply it to the specific pedigree and inheritance information supplied in a question.
In plain language
Genes are DNA sections; alleles are alternatives. A cross works by combining one allele from each parent in every possible gamete pairing.
Self-check
Pedigree schematic: Generation I unaffected father □—○ unaffected mother; their Generation II children are ○ unaffected and ● affected (□ male, ○ female, filled = affected). If the characteristic is recessive, what genotype must the affected child have, and what must be true of the unaffected parents?
Show the answer
The affected child must be aa. Each unaffected parent must have supplied a recessive a allele, so both parents are heterozygous carriers Aa. The unaffected sibling could be AA or Aa; the diagram alone does not distinguish those genotypes.
Topic group
Topic 17 Supplement
- Course content
Scope: Course content · Subject-content route: Extended (Core and Supplement) · Practical examination: any of Paper 5: Practical Test, Paper 6: Alternative to Practical · §3 Topic 17 Inheritance: §17.1 Supplement 5; §17.1 Supplement 6; §17.1 Supplement 7; §17.1 Supplement 8; §17.1 Supplement 9; §17.1 Supplement 10; §17.1 Supplement 11; §17.1 Supplement 12; §17.2 Supplement 1; §17.2 Supplement 2; §17.2 Supplement 3; §17.2 Supplement 4; §17.2 Supplement 5; §17.3 Supplement 1; §17.3 Supplement 2; §17.4 Supplement 13; §17.4 Supplement 14; §17.4 Supplement 15; §17.4 Supplement 16; §17.4 Supplement 17; §17.4 Supplement 18
Open revision guidance
What to know
- A gene’s base sequence determines the amino-acid sequence in a protein; different amino-acid sequences fold into different shapes, which enables different functions. DNA controls cell function by directing proteins such as enzymes, membrane carriers and neurotransmitter receptors. The gene remains in the nucleus; an mRNA copy is made there and moves into the cytoplasm, passes through a ribosome, and the ribosome assembles amino acids in the order specified by the mRNA bases. Transcription/translation detail and nucleotide structure are not required. Most body cells contain the same genes, but cells express different subsets and make the proteins needed for their specialised roles.
- A haploid nucleus has one set of chromosomes; a diploid nucleus has two sets, with a pair of each type. Human diploid cells have 23 pairs. Mitosis is nuclear division producing genetically identical cells: chromosomes replicate exactly before division, copies separate so chromosome number is maintained, enabling growth, tissue repair, replacement and asexual reproduction. Stem cells are unspecialised and divide by mitosis; their daughter cells can specialise. Meiosis makes gametes and halves chromosome number from diploid to haploid, producing genetically different cells; no stage-by-stage account is required.
- An unknown dominant-phenotype genotype is tested by crossing it with a homozygous recessive (aa). If the unknown is AA, all offspring receive A and show the dominant phenotype; if it is Aa, the cross Aa × aa gives half Aa (dominant) and half aa (recessive). In codominance both alleles contribute visibly in a heterozygote. ABO alleles are Iᴬ, Iᴮ and Iᴼ; Iᴬ and Iᴮ are codominant and each dominates Iᴼ. Thus IᴬIᴮ is blood group AB, IᴬIᴼ is A, IᴮIᴼ is B, and IᴼIᴼ is O. Example: IᴬIᴼ × IᴮIᴼ gives gametes Iᴬ/Iᴼ and Iᴮ/Iᴼ; four combinations IᴬIᴮ, IᴬIᴼ, IᴮIᴼ, IᴼIᴼ predict AB, A, B and O in a 1:1:1:1 ratio.
- A sex-linked gene is on a sex chromosome, so the phenotype can be more common in one sex. Red-green colour blindness is an X-linked example. Worked cross: carrier female XᴺXⁿ × unaffected male XᴺY. Female gametes Xᴺ and Xⁿ; male gametes Xᴺ and Y. Offspring: XᴺXᴺ (unaffected daughter), XᴺXⁿ (carrier daughter), XᴺY (unaffected son), XⁿY (colour-blind son). Each is 1/4 expected; among sons, 1/2 are affected. Write chromosome/allele symbols in every cell before counting.
What to do in an assessment
- For protein questions, follow DNA base sequence → mRNA copy in nucleus → mRNA to ribosome → amino-acid sequence → protein shape/function. Distinguish mitosis (same chromosome number, identical cells) from meiosis (half chromosome number, different gametes). For ABO or sex linkage, list the actual gametes, construct every pairing and count phenotypes; do not assume a heterozygote looks recessive.
In plain language
Genes specify protein sequences; mitosis copies cells, meiosis makes varied haploid gametes, and extended crosses include codominant and sex-linked alleles.
Self-check
Cross a carrier female XᴺXⁿ with an unaffected male XᴺY. List all four possible children and the fraction of sons expected to be colour-blind.
Show the answer
Female gametes are Xᴺ and Xⁿ; male gametes are Xᴺ and Y. The combinations are XᴺXᴺ, XᴺXⁿ, XᴺY and XⁿY, each 1/4. One of the two possible sons is XⁿY, so 1/2 of sons are expected to be colour-blind.
Topic group
Topic 18 Core
- Course content
Scope: Course content · Subject-content route: any of Core, Extended (Core and Supplement) · Practical examination: any of Paper 5: Practical Test, Paper 6: Alternative to Practical · §3 Topic 18 Variation and selection: §18.1 Core 1; §18.1 Core 2; §18.1 Core 3; §18.1 Core 4; §18.1 Core 5; §18.1 Core 6; §18.1 Core 7; §18.1 Core 8; §18.2 Core 1; §18.2 Core 2; §18.3 Core 1(a); §18.3 Core 1(b); §18.3 Core 1(c); §18.3 Core 1(d); §18.3 Core 1(e); §18.3 Core 2(a); §18.3 Core 2(b); §18.3 Core 2(c); §18.3 Core 3
Open revision guidance
What to know
- Variation means differences between individuals of the same species. Continuous variation spans a range (for example, body mass or length) and is influenced by genes and environment; discontinuous variation has distinct categories with no intermediates (for example, ABO group or pea seed shape/colour) and is usually genetic only. To investigate, collect the same measurement from a sample for continuous variation and tally named categories for discontinuous variation; use consistent measurement technique, adequate sample size and a frequency table/histogram or category tally as appropriate.
- A mutation is genetic change and the source of new alleles. Ionising radiation and some chemicals increase mutation rate; they do not direct an organism to acquire a useful change. An adaptive feature is an inherited feature that helps survival and reproduction in an environment. In an unfamiliar case, quote the environmental challenge and the feature’s functional effect. For example, a cactus’s thick cuticle and reduced leaves limit water loss in a dry habitat; a floating aquatic leaf can have air spaces that aid buoyancy.
- Natural selection: populations contain inherited genetic variation; more offspring are produced than can survive; individuals compete for limited resources; those with advantageous features are more likely to survive and reproduce; they pass associated alleles to offspring, so those alleles become more common over generations. Selective breeding is artificial: people choose parents with desired traits, cross them, select desirable offspring, and repeat over generations. It can improve crop yield or livestock productivity, but may narrow genetic variation and increase vulnerability to disease.
- Worked stimulus for the source wording “images or other information” (hypothetical classroom example, not a report about an actual species): field notes describe Species X in a dry, sunny habitat; it has narrow leaves, a thick waxy surface and a swollen green stem. Interpretation: the thick waxy surface and reduced leaf area limit water loss; stored water in the stem helps it survive dry periods. Name the observed feature first, then link it to the environmental challenge and survival/reproduction. For variation practice, hypothetical sample observations (invented teaching data): body masses in g = 12, 13, 14, 17, 18, 20 (a range: continuous); pea seeds counted as 7 round and 5 wrinkled (separate categories: discontinuous). These are not official or published measurements. No variation graph is specified by these outcomes; investigate/describe the examples using consistent measurement and category tallies.
What to do in an assessment
- Classify data by asking whether values form a range or separate classes, then link the pattern to genes/environment. For adaptation, connect feature → functional advantage in the stated habitat. For selection, write the complete variation-to-inherited-frequency chain; for selective breeding, identify the human-selected parents and selected offspring over repeated generations.
In plain language
Variation supplies differences on which selection can act; an inherited advantage can become more common across generations.
Self-check
A sample of 40 plants has heights from 12 cm to 38 cm, while the same plants have either purple or white flowers. Classify the two characteristics and give a cause for each pattern.
Show the answer
Height is continuous because it spans a range and is affected by both genes and environment. Flower colour here is discontinuous because it falls into separate categories; it is usually caused by genes only.
Topic group
Topic 18 Supplement
- Course content
Scope: Course content · Subject-content route: Extended (Core and Supplement) · Practical examination: any of Paper 5: Practical Test, Paper 6: Alternative to Practical · §3 Topic 18 Variation and selection: §18.1 Supplement 9; §18.1 Supplement 10; §18.2 Supplement 3; §18.3 Supplement 4; §18.3 Supplement 5; §18.3 Supplement 6
Open revision guidance
What to know
- A gene mutation is a random change in the base sequence of DNA. Mutation creates new alleles. Genetic variation in a population also comes from meiosis, random mating and random fertilisation: they produce new allele combinations without an individual needing to change in response to need.
- Hydrophyte adaptations suit abundant water: for example, floating leaves may be broad with stomata mainly on the upper surface, and air spaces aid flotation/gas movement. Xerophytes face water shortage: examples include a thick waxy cuticle, reduced leaves/spines, sunken stomata, water-storing tissues and extensive roots. In each case explain how a feature improves survival in that specific environment; do not merely list it.
- Adaptation is the population-level process by which natural selection makes populations more suited to their environment over many generations. Antibiotic-resistant strains develop by the same selection logic: random resistant variants exist; antibiotic exposure kills susceptible bacteria more readily; resistant bacteria survive and reproduce; their resistance alleles become more frequent. Natural selection has environmental pressures and no deliberate chooser; artificial selection has humans choosing parents/offspring for desired traits. Both alter which inherited characteristics become common across generations, but their selecting agents differ.
What to do in an assessment
- For an adaptation explanation, name the feature and connect its effect to water availability. In selection examples distinguish random source of variation from the selective pressure and inherited outcome. State “more common over generations”, not that every individual transforms.
In plain language
Mutations and sexual reproduction generate variation; natural selection changes allele frequencies as environments favour some variants.
Self-check
In a dry habitat, explain why a plant with a thick waxy cuticle may leave more offspring than one without it.
Show the answer
The thick waxy cuticle reduces water loss by evaporation. In a dry habitat this helps the plant maintain water, survive and reproduce; if the feature is inherited, its allele can be passed to offspring and become more common over generations.
Topic group
Topic 19 Core
- Course content
Scope: Course content · Subject-content route: any of Core, Extended (Core and Supplement) · Practical examination: any of Paper 5: Practical Test, Paper 6: Alternative to Practical · §3 Topic 19 Organisms and their environment: §19.1 Core 1; §19.1 Core 2; §19.2 Core 1; §19.2 Core 2; §19.2 Core 3; §19.2 Core 4; §19.2 Core 5; §19.2 Core 6; §19.2 Core 7; §19.2 Core 8; §19.2 Core 9; §19.2 Core 10; §19.2 Core 11; §19.2 Core 12; §19.2 Core 13; §19.2 Core 14; §19.3 Core 1; §19.4 Core 1; §19.4 Core 2; §19.4 Core 3; §19.4 Core 4; §19.4 Core 5; §19.4 Core 6
Open revision guidance
What to know
- The Sun is the principal energy input to biological systems. Producers capture light in photosynthesis and store chemical energy in organic molecules; feeding transfers chemical energy through consumers and decomposers. At each transfer, energy is used in respiration and dissipated to the environment as heat; material in uneaten parts and waste also carries energy away from the next trophic level. Energy flows and is eventually transferred to the environment; it is not recycled like matter.
- A food chain shows energy transfer from a producer to consumers; arrows point from the organism eaten to the eater. A food web is interconnected chains. Producers make organic nutrients (usually by photosynthesis); consumers feed on organisms; primary, secondary, tertiary and quaternary consumers occupy successive feeding positions. Herbivores eat plants, carnivores eat animals, and decomposers obtain energy from dead/waste organic material. Trace all affected links to explain overharvesting or an introduced species: removing a prey species can reduce its predators and release organisms it previously ate.
- Pyramids: numbers count organisms at each trophic level; biomass compares total dry mass per area; bars represent trophic levels, with producers at the base. Numbers can be inverted (one tree can support many insects), whereas biomass better represents material present but can vary with sampling time. Energy pyramids show energy transferred per area per time, always narrow upward and best represent flow/efficiency; biomass and numbers are standing quantities. For example, if producers hold 20 000 kJ m⁻² year⁻¹ and primary consumers receive 2 000, transfer efficiency is (2 000 ÷ 20 000) × 100 = 10%. Because much energy is lost at each transfer, chains usually have fewer than five trophic levels and eating crop plants directly is more energy-efficient than feeding them to livestock first.
- The carbon cycle: photosynthesis removes carbon dioxide and makes organic molecules; feeding transfers carbon; respiration and decomposition return carbon dioxide; some dead material forms fossil fuels over long periods; combustion releases their carbon dioxide. A population is one species in one area at one time; a community is all populations of different species; an ecosystem includes that community and its interacting environment. Food supply, competition, predation and disease affect population growth. A sigmoid curve has lag, exponential/log, stationary and death phases; interpret it by reading axes, identifying where rate changes, and relating changes to resource limitation.
- Worked food-web diagram in arrows (hypothetical habitat; arrows point from food to consumer): grass → grasshopper → frog → snake; grass → rabbit → fox; grasshopper → bird → snake. If grasshoppers decline, frogs and insect-eating birds may have less food; frogs may also provide less food to snakes. Human-impact application (hypothetical): overharvesting rabbits reduces fox food, while an introduced predator that eats frogs can reduce frogs and alter food available to snakes. Trace arrows both downstream to predators and backward to the food organisms released from predation. A simple numbers pyramid example is 1000 grass plants → 100 grasshoppers → 10 small birds; a corresponding hypothetical biomass set might be 10 000 g → 1 000 g → 100 g. Bars should be stacked by trophic level, with the producer base widest in this example. These invented values are solely practice, not official ecosystem measurements. Numbers can be inverted in a tree-based chain, which is one reason biomass can represent feeding material more usefully.
- Worked population-curve interpretation for the same hypothetical habitat (grasshopper counts, not official statistics): day 0 = 10, day 2 = 14, day 4 = 29, day 6 = 58, day 8 = 95, day 10 = 100, day 12 = 100, day 14 = 72. If plotted as population size against time, the slow initial rise is lag, the rapid rise is exponential/log, the near-constant 95–100 interval is stationary, and the fall to 72 is a death/decline phase. Read axes and intervals before naming phases; explain a plateau or fall using limiting factors such as food, competition, predation or disease. The keyed population-growth gallery plots these exact observations as an actual graph; use its unlabelled practice mode before consulting the closed key.
What to do in an assessment
- On a chain/web, follow arrow direction and identify each trophic role before predicting indirect effects. For pyramid questions, identify whether the bars show number, biomass or energy and include the unit/area/time basis if provided. For transfer efficiency calculate (energy at next level ÷ energy at previous level) × 100. On a population curve, read the axes, locate phase transitions, then explain changes using food, competition, predation, disease and other limiting resources.
In plain language
Energy enters mainly from the Sun and moves through feeding relationships; populations and nutrient cycles interact within ecosystems.
Self-check
A producer level contains 12 000 kJ and the primary-consumer level contains 1 800 kJ. Calculate transfer efficiency and state why the next level contains less energy.
Show the answer
Efficiency = (1 800 ÷ 12 000) × 100 = 15%. Some energy is used in respiration and lost as heat; other energy is in uneaten material or waste, so less is transferred to the next trophic level.
View diagrams
Food web Food webHypothetical habitat · schematic, not to scaleTarget Organism Trophic role A ________________ ________________ B ________________ ________________ C ________________ ________________ D ________________ ________________ E ________________ ________________ F ________________ ________________ G ________________ ________________ Food → Consumer A B B C C D A E E F B G G D Show labelled key: Answer key for food-web
Food web Food webHypothetical habitat · schematic, not to scaleTarget Organism Trophic role A Grass Producer B Grasshopper Primary consumer C Frog Secondary consumer D Snake Tertiary consumer E Rabbit Primary consumer F Fox Secondary consumer G Bird Secondary consumer Food → Consumer Grass Grasshopper Grasshopper Frog Frog Snake Grass Rabbit Rabbit Fox Grasshopper Bird Bird Snake Pyramids of numbers and biomass Pyramid of numbers
Pyramid of biomass
Hypothetical practice values only: not an actual ecosystem sample or official statistics. Numbers count organisms; biomass is total dry mass. Both examples show three trophic levels and use proportionally scaled bar widths.
Trophic level Number of organisms Biomass (g dry mass) Grass plants 1,000 10,000 Grasshoppers 100 1,000 Small birds 10 100 Show labelled key: Answer key for trophic-pyramids
Pyramids of numbers and biomass Pyramid of numbers
Pyramid of biomass
Hypothetical practice values only: not an actual ecosystem sample or official statistics. Numbers count organisms; biomass is total dry mass. Both examples show three trophic levels and use proportionally scaled bar widths.
Trophic level Number of organisms Biomass (g dry mass) Grass plants 1,000 10,000 Grasshoppers 100 1,000 Small birds 10 100 Population growth over time Population growth over timeShared hypothetical habitat: grasshopper population; straight joins, no extra observationsTime (days) Population (organisms) 0 10 2 14 4 29 6 58 8 95 10 100 12 100 14 72 Show labelled key: Answer key for population-growth
Population growth over time Population growth over timeShared hypothetical habitat: grasshopper population; straight joins, no extra observationsTime (days) Population (organisms) 0 10 2 14 4 29 6 58 8 95 10 100 12 100 14 72 Interpret the food web, linked grass/grasshopper/small-bird pyramids, and grasshopper population curve as one hypothetical habitat dataset; practice and key modes share the same values.
Topic group
Topic 19 Supplement
- Course content
Scope: Course content · Subject-content route: Extended (Core and Supplement) · Practical examination: any of Paper 5: Practical Test, Paper 6: Alternative to Practical · §3 Topic 19 Organisms and their environment: §19.2 Supplement 15; §19.2 Supplement 16; §19.2 Supplement 17; §19.2 Supplement 18; §19.2 Supplement 19; §19.3 Supplement 2; §19.3 Supplement 3; §19.4 Supplement 7
Open revision guidance
What to know
- Energy transfer is often inefficient because organisms use chemical energy in respiration (released as heat), do not digest/assimilate all food, and lose energy in faeces, urine or uneaten parts. Less energy remains as biomass available to the next trophic level. Thus few chains have five or more levels. Humans obtain more of crop energy by eating plants directly than by feeding crops to livestock first, because each extra trophic transfer loses energy.
- Nitrogen cycle sequence: decomposers break down plant/animal protein to ammonium ions; nitrifying microorganisms convert ammonium to nitrate; nitrogen fixation by lightning and bacteria adds usable nitrogen compounds; plants absorb nitrate and make amino acids/proteins; animals feed and digest protein; deamination removes the amino group from excess amino acids; denitrifying microorganisms return nitrogen from nitrate to the atmosphere. The named microorganism roles are decomposition, nitrification, nitrogen fixation and denitrification; memorising species names is not required.
- A sigmoid population curve: lag phase has slow growth while organisms establish/reproduce; exponential phase has rapid growth while resources are plentiful; stationary phase occurs as limiting factors such as food, space, competition, predation or disease balance births; death phase occurs when deaths exceed births, often as resources become severely limiting. The exact cause depends on the data/context.
What to do in an assessment
- For energy-loss questions name where energy goes rather than just saying “energy is lost”. For the nitrogen cycle, keep the ion names and process order clear: protein → ammonium → nitrate → plant protein → animal protein → deamination, with fixation adding and denitrification returning nitrogen. For each sigmoid phase, state the population trend and a matching resource/limiting-factor explanation.
In plain language
Nitrogen cycles through organisms, ions and the atmosphere; energy is lost at each feeding step, limiting food-chain length.
Self-check
Plants absorb nitrate, an animal eats the plant, and decomposers act after it dies. Name the next nitrogen-cycle form after decomposition and the process that can return nitrogen to the atmosphere.
Show the answer
Decomposition of the plant/animal protein produces ammonium ions. Denitrification by microorganisms converts nitrate to nitrogen returned to the atmosphere.
Topic group
Topic 20 Core
- Course content
Scope: Course content · Subject-content route: any of Core, Extended (Core and Supplement) · Practical examination: any of Paper 5: Practical Test, Paper 6: Alternative to Practical · §3 Topic 20 Human influences on ecosystems: §20.1 Core 1(a); §20.1 Core 1(b); §20.1 Core 1(c); §20.1 Core 1(d); §20.1 Core 1(e); §20.1 Core 2; §20.1 Core 3; §20.2 Core 1; §20.2 Core 2(a); §20.2 Core 2(b); §20.2 Core 2(c); §20.2 Core 3; §20.2 Core 4; §20.3 Core 1; §20.3 Core 2; §20.3 Core 3; §20.4 Core 1; §20.4 Core 2; §20.4 Core 3; §20.4 Core 4(a); §20.4 Core 4(b); §20.4 Core 4(c); §20.4 Core 4(d)
Open revision guidance
What to know
- Food production rises through machinery (cultivates larger areas/more efficiently), chemical fertilisers (replace mineral nutrients and improve yields), insecticides (reduce crop damage), herbicides (reduce weed competition), and selective breeding (improves crop or livestock traits). A large monoculture simplifies planting/harvesting and can yield efficiently, but low crop diversity can allow a pest/disease to spread widely and repeated inputs can affect ecosystems. Intensive livestock production can use space/feed efficiently and provide predictable output, but crowding creates welfare/disease concerns and concentrated waste/pollution; balance benefits and costs in context.
- Biodiversity is the number of different species living in an area. Habitat destruction arises from land conversion for housing, crop and livestock production, resource extraction and freshwater/marine pollution. Changing food chains/webs can reduce prey, predators or competitors and harm habitats. Deforestation reduces habitats and biodiversity and can cause extinction; exposed soil is eroded, less water is intercepted/infiltrated so flooding may increase, and less carbon is stored while burning/decay releases carbon dioxide, increasing atmospheric CO₂.
- Untreated sewage adds organic matter and microorganisms; decomposition/respiration uses dissolved oxygen, harming aquatic organisms. Excess fertiliser adds nutrients and can trigger algal/producer growth followed by oxygen depletion as biomass dies and decomposes. Non-biodegradable plastics persist, entangle or are eaten by organisms in aquatic and terrestrial habitats and can enter food chains. Methane and carbon dioxide arise from sources including combustion/fossil fuels, livestock and decomposition; increased concentrations strengthen the greenhouse effect and contribute to climate change.
- A sustainable resource is replaced as rapidly as it is removed so it does not run out. Forest and fish resources can be managed sustainably. Organisms become endangered/extinct through climate change, habitat destruction, hunting, overharvesting, pollution and introduced species. Conservation may monitor/protect species and habitats, educate communities, breed endangered organisms in captivity and store seeds in seed banks. These approaches address threats while preserving remaining populations.
What to do in an assessment
- For a food-production technique, identify its direct yield benefit and a context-specific cost. For deforestation/pollution, build a cause → ecological process → consequence chain. For conservation, pair the threat with an intervention and explain how it sustains a resource or protects an organism.
In plain language
Food production can increase yields but environmental pressures alter habitats; sustainability means removal does not outpace replacement.
Self-check
Explain two ways deforestation can harm ecosystems, linking each cause to a consequence.
Show the answer
Removing trees destroys habitats, so species may decline or become extinct and biodiversity falls. Without tree roots and canopy, soil is less held in place and less rainfall is intercepted, increasing erosion and flood risk; loss of stored carbon or burning also raises atmospheric carbon dioxide.
Topic group
Topic 20 Supplement
- Course content
Scope: Course content · Subject-content route: Extended (Core and Supplement) · Practical examination: any of Paper 5: Practical Test, Paper 6: Alternative to Practical · §3 Topic 20 Human influences on ecosystems: §20.3 Supplement 4; §20.4 Supplement 5; §20.4 Supplement 6; §20.4 Supplement 7(a); §20.4 Supplement 7(b); §20.4 Supplement 7(c); §20.4 Supplement 7(d); §20.4 Supplement 8; §20.4 Supplement 9
Open revision guidance
What to know
- Eutrophication sequence: fertiliser runoff raises nitrate and other ion availability; producers (especially algae) grow rapidly; many die; decomposers break down the dead biomass and increase aerobic respiration; dissolved oxygen falls; organisms that require oxygen die. Explain the causal sequence rather than stating only “algae use oxygen”.
- Forests can be conserved through education, protected areas, quotas on harvesting and replanting. Fish stocks can be conserved through education, closed seasons during reproduction, protected areas, controlled net types and mesh sizes that allow young fish to escape, quotas and monitoring. Each measure limits removal, enables reproduction or checks whether stocks recover.
- Conservation programmes maintain/increase biodiversity, reduce extinction risk, protect vulnerable ecosystems and maintain ecosystem functions such as nutrient cycling and provision of resources including food, drugs, fuel and genes. Captive breeding can use artificial insemination (sperm introduced to a female’s reproductive tract) or IVF (egg and sperm fertilise outside the body; an embryo is transferred) when natural mating is difficult. If a population becomes small, fewer alleles may remain and relatives are more likely to breed; reduced genetic variation makes the species less able to respond to environmental change or disease. Genetic drift detail is not required.
What to do in an assessment
- For eutrophication, use the complete ordered chain from nutrient input to death of oxygen-dependent organisms. For forest/fish management, connect each measure to reduced harvest or recovery. When discussing a small population, distinguish the risk (loss of variation) from its consequence (less capacity to respond); do not introduce unrequired genetic-drift detail.
In plain language
Conservation controls resource use and protects biodiversity; nutrient runoff can trigger a chain ending in oxygen depletion.
Self-check
A fertiliser spill enters a lake. Give the ordered events that can lead to fish deaths.
Show the answer
Nitrate/other ions become more available; algae and other producers grow rapidly; they die; decomposers break them down and respire aerobically; dissolved oxygen falls; fish and other organisms requiring dissolved oxygen die.
Topic group
Topic 21 Core
- Course content
Scope: Course content · Subject-content route: any of Core, Extended (Core and Supplement) · Practical examination: any of Paper 5: Practical Test, Paper 6: Alternative to Practical · §3 Topic 21 Biotechnology and genetic modification: §21.1 Core 1; §21.2 Core 1; §21.2 Core 2; §21.2 Core 3; §21.2 Core 4; §21.3 Core 1; §21.3 Core 2(a); §21.3 Core 2(b); §21.3 Core 2(c); §21.3 Core 2(d)
Open revision guidance
What to know
- Bacteria are useful in biotechnology/genetic modification because they reproduce rapidly and can make complex molecules. Anaerobic respiration by yeast produces ethanol and carbon dioxide: ethanol is collected as a biofuel; in bread dough, carbon dioxide bubbles make the dough rise and ethanol evaporates during baking. Pectinase breaks down pectin in fruit cell walls, helping release juice and improve yield/clarity.
- Biological washing powders contain enzymes that break down stains. A fair investigation: cut equal cloth squares, apply equal amounts of a known stain, allow the same time to dry, then wash with equal volume/concentration of powder for equal time at the same measured temperature and agitation. Compare an enzyme detergent with an enzyme-free/control wash, repeat each treatment, and score stain remaining using the same scale or measure colour consistently. Keep fabric, stain, detergent amount, water volume, time and temperature controlled; handle hot water/detergents safely and follow product guidance.
- Genetic modification changes an organism’s genetic material by removing, changing or inserting individual genes. Examples include human genes inserted into bacteria to produce human proteins; crop genes for herbicide resistance or insect-pest resistance; and genes that improve nutritional qualities. These are distinct aims, and an exam response should state the gene change and intended characteristic.
What to do in an assessment
- For fermentation, name the organism, anaerobic conditions, substrate/product and use. For a washing-powder test, state the control, measured cleaning outcome, controlled variables, repeats and safe handling. For genetic modification examples, link an inserted/changed gene to the resulting useful feature.
In plain language
Microbes can produce useful substances at scale, and a genetic change can give an organism a chosen characteristic.
Self-check
A student compares enzyme washing powder with ordinary detergent. State a suitable control, two variables to keep constant, and how to compare results.
Show the answer
Use ordinary detergent without the tested enzyme as a control (or an identical wash without enzyme). Keep fabric/stain and stain amount, detergent mass/concentration, water volume, temperature, wash time and agitation constant. Repeat and compare remaining stain using the same scoring scale or a consistent colour measurement.
Topic group
Topic 21 Supplement
- Course content
Scope: Course content · Subject-content route: Extended (Core and Supplement) · Practical examination: any of Paper 5: Practical Test, Paper 6: Alternative to Practical · §3 Topic 21 Biotechnology and genetic modification: §21.1 Supplement 2(a); §21.1 Supplement 2(b); §21.2 Supplement 5; §21.2 Supplement 6; §21.2 Supplement 7; §21.3 Supplement 3(a); §21.3 Supplement 3(b); §21.3 Supplement 3(c); §21.3 Supplement 3(d); §21.3 Supplement 3(e); §21.3 Supplement 3(f); §21.3 Supplement 4
Open revision guidance
What to know
- Bacteria have plasmids, small circular DNA molecules that can carry inserted genes. Their rapid reproduction can generate many copies quickly and they can make complex proteins. Their manipulation/growth raises relatively few ethical concerns compared with many animal interventions, though biosafety and responsible containment still matter.
- Lactase hydrolyses milk sugar lactose into glucose and galactose, producing lactose-free/reduced-lactose milk. Fermenters enable large-scale production by bacteria or fungi of useful products including insulin, penicillin and mycoprotein. Control temperature near the organism/enzyme optimum, pH, oxygen supply where aerobic growth is needed, nutrient supply and removal/control of waste products; sensors and mixing help maintain conditions. Sterility reduces contamination, which competes for substrate or spoils product.
- Recombinant human-protein process: isolate DNA containing the human gene using a restriction enzyme, leaving sticky ends; cut a bacterial plasmid with the same enzyme so its ends are complementary; join gene and plasmid with DNA ligase to form a recombinant plasmid; insert plasmids into bacteria; grow/multiply bacteria carrying them; bacteria express the human gene and make its protein. The matched sticky ends allow base pairing and ligase seals the DNA backbone. Crop GM examples include herbicide-resistant soya, insect-resistant maize and nutritionally improved rice, as well as genes for herbicide resistance, insect-pest resistance or improved nutritional quality in crops. Potential advantages include reliable yield, reduced crop loss and improved nutrient content; disadvantages/risks include gene escape to wild relatives, effects on non-target organisms, resistant pests/weeds, reduced biodiversity and dependence on seed suppliers. Evaluate both sides for the named crop and trait rather than asserting all GM crops have the same effect.
What to do in an assessment
- In a fermenter answer, name each controlled condition and why it matters to growth/product yield or contamination. For recombinant DNA, preserve the order: isolate/cut human gene → cut plasmid with same enzyme → ligase → insert into bacteria → multiply → express. In crop evaluations distinguish a potential benefit from a possible environmental/economic risk.
In plain language
Plasmids can carry a human gene into bacteria; controlled growth lets microbes make useful products in bulk.
Self-check
Put the recombinant-protein steps in order after choosing a human gene: ligase joins DNA; cut plasmid with the same restriction enzyme; bacteria express the gene; insert plasmid into bacteria; isolate human gene with sticky ends; multiply bacteria; form recombinant plasmid.
Show the answer
Isolate the human gene with a restriction enzyme to form sticky ends; cut the plasmid with the same enzyme; join gene and plasmid with DNA ligase to form a recombinant plasmid; insert it into bacteria; multiply the bacteria; the bacteria express the human gene and make the protein.
Topic group
Assessment
- Course content
Scope: Course content · Subject-content route: any of Core, Extended (Core and Supplement) · Practical examination: any of Paper 5: Practical Test, Paper 6: Alternative to Practical · §2 and §4, pp. 9, 49–50; 0970 papers, grade eligibility and entry rules
Open revision guidance
What to know
- Core candidates take Paper 1 multiple choice (40 marks, 45 min) and Paper 3 theory (80 marks, 1 h 15 min), plus Paper 5 or 6; they are eligible for grades 5–1 and Core has a maximum grade 5. Extended studies Core plus Supplement and takes Papers 2 and 4, plus Paper 5 or 6; candidates are eligible for grades 9–1. Source guidance: Core for candidates expected grade 3 or below; Extended for candidates expected grade 4 or above.
- Paper 5 is a 40-mark, 1 h 15 min practical test in a laboratory; Paper 6 is a 40-mark, 1 h alternative without experiments being performed. Both test AO3 and require the same experimental skills. 0970 is the separate 9–1 award, not 0610 under a different grading display.
What to do in an assessment
- Match entry papers to the studied content and grade route; confirm 0970 availability in the centre’s administrative zone before entry.
In plain language
0970 is the Cambridge 9–1 award with Core or Extended theory papers and one practical examination.
Self-check
Which papers and maximum grade apply to a Core 0970 candidate?
Show the answer
Papers 1 and 3 plus Paper 5 or 6; Core candidates are eligible for grades 5 to 1, so the maximum is 5.
Topic group
Assessment and weighting
- Course content
Scope: Course content · Subject-content route: any of Core, Extended (Core and Supplement) · Practical examination: any of Paper 5: Practical Test, Paper 6: Alternative to Practical · §2 assessment overview, pp. 9–10; §4, pp. 49–50
Open revision guidance
What to know
- Paper 1 or 2 contributes 30% (40 marks, 45 minutes); Paper 3 or 4 contributes 50% (80 marks, 1 hour 15 minutes); Paper 5 or 6 contributes 20% (40 marks; Paper 5 is 1 hour 15 minutes, Paper 6 is 1 hour). AO weight across the qualification: AO1 knowledge/understanding 50%, AO2 handling information/problem-solving 30%, AO3 practical skills/investigations 20%. In Papers 1–4, AO1 is approximately 63% and AO2 37%; Papers 5–6 assess AO3 only. For 0970, Core entries are eligible grades 5–1; Extended (Core plus Supplement) grades 9–1. The subject-content route and one practical component are separate selections.
What to do in an assessment
- Before an exam, identify route, theory components and practical choice separately; interpret component weight as a percentage of the qualification and AO weight as a percentage within the named scope.
In plain language
Theory contributes 80% and one practical paper contributes 20%; the AOs describe what each paper assesses.
Self-check
A learner studies Core and selects Paper 6. Which theory papers are required, how much does Paper 6 contribute, and which AO does it test?
Show the answer
Papers 1 and 3; Paper 6 contributes 20% and tests AO3 experimental skills/investigations.
Topic group
Maths and data
- Course content
Scope: Course content · Subject-content route: any of Core, Extended (Core and Supplement) · Practical examination: any of Paper 5: Practical Test, Paper 6: Alternative to Practical · §4, pp. 54–57, and §5, p. 58; mathematics, data display, conventions and command words
Open revision guidance
What to know
- Use ratios, percentages, standard form, significant figures, equations, unit conversions, areas/volumes and surface-area:volume ratio. Calculate means/ranges, gradients/intercepts and use probability; draw and interpret line graphs, bar charts, pie charts and histograms. Table/graph headings include quantity and unit; record to instrument precision; use sensible axes/scales and accurate points. Biological drawings are clear pencil lines, proportionate, unshaded and correctly labelled.
- Know the syllabus command words: calculate, compare, define, describe, determine, evaluate, explain, give, identify, outline, predict, sketch, state and suggest.
- Number and algebra worked methods: show all four operations with decimals/fractions; convert ratios to a consistent form and use reciprocals; percentage change = (final − initial) ÷ initial × 100. For example, a mass change from 2.0 g to 2.5 g is 25%. Write 0.00032 as 3.2 × 10⁻⁴; round 12.678 to 3 significant figures as 12.7 or to 2 decimal places as 12.68, as requested. Use direct proportion when doubling one quantity doubles another; use inverse proportion when doubling one quantity halves another. Rearrange a simple formula by doing the same operation to both sides, then substitute values with units; magnification = image size ÷ actual size, so image 6 mm and actual 0.12 mm gives ×50. Measurement and geometry: convert units before calculating (0.42 mm = 420 μm; 1 dm³ = 1000 cm³); measure with a ruler from zero and estimate sensibly. Rectangle area = length × width; triangle area = base × perpendicular height ÷ 2; circle area = πr². Rectangular-block volume = length × width × height; cylinder volume = πr²h. For a specimen with surface area 6 mm² and volume 2 mm³, surface area ÷ volume = 3 mm⁻¹ when lengths are measured in millimetres; report units consistently. Read scale diagrams using the drawing scale and report a suitable SI/approved unit. Define geometric terms such as radius, diameter, circumference, perpendicular height and area when they determine a calculation. Graphs, statistics and data conventions: place the independent variable on x and dependent on y; axes carry quantity/unit, table headings use quantity / unit and units do not repeat in body cells. Record every reading to instrument precision and use consistent significant figures. Use a line graph for continuous paired data, separated equal-width bars for discrete categories, a pie chart for proportions (sector angle = fraction × 360°), and touching bars/equal class intervals for continuous-data histograms. Choose scales spanning most of the graph, plot accurately and draw one thin smooth best-fit line/curve; identify anomalies rather than silently deleting them. Interpolate within data and extrapolate beyond cautiously. Gradient = change in y ÷ change in x using a large triangle and report the compound unit; for 24 cm³ over 8 min, gradient = 3 cm³ min⁻¹. State whether a graph shows direct proportionality (straight line through origin). Mean = total ÷ number; range = maximum − minimum; simple probability = favourable outcomes ÷ total equally likely outcomes. For example, values 4, 5, 9 have mean 6 and range 5. Biological drawing conventions: use sharp pencil, clear single unbroken lines, observed proportions and adequate space; no shading or colour; use ruled label lines that touch the intended feature and do not cross. A drawing is an observation, not an artistic reconstruction. Command words: calculate means derive a numerical answer with working; compare means identify similarities and/or differences; define gives a precise meaning; describe reports features or trends; determine finds an answer from information/data; evaluate weighs strengths/limitations against evidence; explain gives a reason or causal account; give states an answer without requiring explanation; identify names or locates; outline gives main features; predict states an expected result from evidence; sketch shows main features without exact scale; state gives a concise fact; suggest applies knowledge to a new context. Use decimal points, consistent number grouping, defined variables and SI/approved units.
- Exact graph and conventions checks: use more than half the grid in both directions when sensible, choose scales based on simple 1/2/5 intervals (for example 2 cm for 1, 2 or 5 units), and remember axes need not start at zero. Mark plotted points as crosses or circled dots; each should be accurate to half a smallest grid square. Draw one thin smooth straight line/curve only when intermediate values are reasonably predictable; with scatter, balance points on either side, ignore clearly anomalous points for the fit, and show construction when reading an interpolated/extrapolated value to half a smallest square. Recognise direct proportionality from a straight line through the origin and inverse proportionality from the relevant decreasing relationship. Use equal class intervals for histograms. Geometry vocabulary includes angle, curve, circle, radius, diameter, circumference, square, rectangle and diagonal; convert mg/g/kg, μm/mm/cm/m and cm³/dm³ before applying the source-required area/volume formulas. Use a single decimal point and source-consistent grouping (1000–9999 unseparated; ≥10 000 grouped with spaces), define variables, use consistent SI/approved units, and retain supplied units unless the question asks for conversion.
What to do in an assessment
- Show working and units; select graph type from data; use an appropriate best-fit line and reference evidence when drawing a conclusion.
- For every calculation show formula, substitution, unit and sensible rounding; for every graph/table identify variable roles, data type, scale/precision and evidence-based interpretation before writing the conclusion.
In plain language
Accurate calculations and clear presentation make data useful evidence.
Self-check
A graph changes by 24 cm³ over 8 minutes. What is its gradient and unit?
Show the answer
24 ÷ 8 = 3 cm³ min⁻¹.
Topic group
Practical skills
- Course content
Scope: Course content · Subject-content route: any of Core, Extended (Core and Supplement) · Practical examination: any of Paper 5: Practical Test, Paper 6: Alternative to Practical · §3 preface and §4, pp. 12, 50–53; practical contexts, skill outcomes, equipment and safety
Open revision guidance
What to know
- Both practical routes share contexts including diffusion, osmosis, food tests, enzyme rates, pH, photosynthesis, transpiration, heart/breathing rate, respiration, tropisms, seeds/flowers, germination, variation, sampling, unfamiliar specimens, drawings and magnification. Plan variables, controls, range, repeats, apparatus, risks and predictions; take precise measurements; record tables; process, graph and interpret data; justify conclusions, identify anomalies/errors and improve methods.
- Paper 5 requires laboratory experiments; Paper 6 does not require experiments, but assesses the same AO3 skill set and experimental contexts. Use apparatus and reagents safely.
- Equipment demonstration and selection: zero a balance before weighing, use a graduated measuring cylinder for liquid volume, read a ruler at eye level in millimetres, read a thermometer after equilibration, start/stop a stop-clock consistently, and use syringes or a pipette to transfer measured volumes without mouth pipetting. Identify the purpose and safe handling of beakers, test-tubes and racks, bungs/delivery tubes, funnels/filter paper, forceps, glass rods, hand lenses, lamps, needles/seeker, scissors, cutting/marking tools, dialysis tubing, Petri dishes, spotting tiles, wash bottle, white tile/cutting surface and millimetre ruler. Choose apparatus by the quantity, range and precision needed; label and draw apparatus clearly, keep glassware stable, cut away from fingers and follow local centre rules. Reagent demonstrations: iodine plus sample gives blue-black for starch; Benedict's plus sample must be heated in a hot-water bath for a reducing-sugar colour/precipitate; Biuret reagent gives lilac/purple for protein; ethanol followed by water gives a cloudy emulsion for fat/oil; blue DCPIP is decolourised by vitamin C. Demonstrate pH with universal indicator, litmus or other specified indicator; limewater tests carbon dioxide; hydrogencarbonate indicator compares carbon-dioxide conditions; hydrogen peroxide, methylene blue, petroleum jelly, sodium chloride and sodium hydrogencarbonate are used only in source-relevant investigations with the stated method. Use enzymes, water and food substances as controlled materials. Record the actual colour/observation before inferring a result. Safe-practical routine: read hazard information and method first; use appropriate eye protection and gloves where indicated; keep ethanol away from ignition and never heat it over a naked flame; use a water bath for Benedict's/ethanol procedures; use forceps or a holder for hot apparatus; never taste samples, mouth-pipette, or directly handle hazardous biological/chemical material. Identify the risk, the route of exposure, a specific precaution and disposal rule. For unfamiliar instructions, check apparatus connections/leaks and arrange equipment before starting. Worked method pattern across the syllabus contexts: state the independent variable, the measurable dependent variable, controlled variables, a useful range, repeats, apparatus and safety; include a control/comparison where it tests the claim. For diffusion, change one factor such as cube size and measure penetration; for osmosis, blot consistently and compare initial/final mass; for food/pH tests, use equal sample/reagent volumes and record qualitative endpoints; for enzyme rates, define a colour endpoint and keep pH/concentrations fixed; for photosynthesis, measure a stated proxy and control other limiting factors; for transpiration, distinguish potometer uptake from water loss; for heart/breathing/respiration, standardise interval and activity safely; for tropisms, use matched illuminated/control seedlings; for seed/flower dissection, use a tray, forceps and clear observed line drawing; for germination, vary a stated condition while holding others constant; for variation, use a representative sample and simple random selection to reduce bias. Repeat measurements, tabulate to instrument precision, plot suitable graphs, identify anomalies, support conclusions with data, then connect each limitation/error to a specific improvement. Paper 5 requires laboratory performance; Paper 6 assesses the same experimental contexts and skills from provided information without candidate experiment performance.
- Exact apparatus familiarity and demonstrations: the listed balance measures up to 500 g with precision of at least 0.1 g; demonstrate zeroing and recording to 0.1 g. Graduated rulers read millimetres; hand lenses provide at least ×6; stop-clocks read to 1 s or better; thermometers span −10°C to +110°C with 1°C graduations; syringes include 1, 5 and 10 cm³; measuring cylinders include 10, 25 and 100 cm³. Recognise standard/large test tubes (125 × 15 mm and 150 × 25 mm), matching bungs and delivery tubes, filter funnels/paper, forceps, glass rods, lamps, scalpels/sharp knives, glassware markers, mounted needles/seekers/pins, scissors, partially permeable membrane tubing, Pasteur/dropper pipettes, Petri dishes, spotting tiles, racks/holders, wash bottles, white tiles and cutting surfaces. Practise reading diagrams of analogue/digital instruments and choosing a scale whose resolution matches the required quantity/range. Examine each chemical hazard instruction: hazard codes C = corrosive, HH = health hazard, MH = moderate hazard, T = acutely toxic, F = flammable, O = oxidising, N = hazardous to the aquatic environment; learn these meanings but note that the syllabus says candidates are not assessed on the codes. Centres are responsible for local rules, first aid, disposal, current hazard data and providing suitable eye protection/gloves; actual exam hazards are specified in the confidential instructions.
- Worked safe classroom protocols tied to the source practical outcomes: (1) Osmosis with plant tissue—prepare labelled distilled-water and teacher-prepared sodium-chloride solutions, use equal-sized potato strips, measure and record initial mass, immerse each for the same time/temperature, blot each in the same way, then record final mass. Use several concentrations, at least three replicates, keep strip dimensions and solution volume constant, and calculate percentage mass change = (final − initial) ÷ initial × 100; wear eye protection, do not taste material, and dispose/clean as directed. A result such as 2.00 g to 2.20 g is +10.0%. (2) Amylase/starch rate—use equal volumes/concentrations, keep pH and temperature constant, start timing on mixing, transfer a drop at regular intervals to iodine on a spotting tile with a clean pipette, stop at a pre-defined endpoint and repeat; iodine is applied to the tile, not added back to the reaction, and goggles/gloves and teacher-approved enzyme handling are used. Record time to endpoint and compare rates as 1/time only when the same endpoint/method is used. For either method, include the independent/dependent variables, constants, a suitable control, a labelled results table with units, repeats, data-based conclusion, anomaly and a linked improvement; Paper 6 questions test equivalent planning/interpretation without the candidate performing the experiment.
What to do in an assessment
- Define variables and repeats; use instrument precision and units; link each identified limitation to a concrete improvement.
- Demonstrate the apparatus/reagent routines described in the teaching points before assessment; for each unfamiliar practical, rehearse the full cycle: select and check equipment → work safely → record precise observations → process/analyse → conclude from evidence → evaluate a specific error and improvement.
In plain language
Practical biology tests a controlled method, safe measurements and evidence-based evaluation.
Self-check
Why repeat measurements in a rate experiment?
Show the answer
Repeats reveal variability and allow a mean to be calculated, making the result more reliable.
Topic group
Reviewed requirements
- Course content
Scope: Course content · Subject-content route: any of Core, Extended (Core and Supplement) · §3 Topic 2 §2.1 Core 3 — actual plant, animal and bacterial cell images, in addition to diagram identification.
Open revision guidance
What to know
- The actual-image set complements the schematic identification practice. Onion and Elodea light micrographs show cell walls and nuclei (onion), and walls, chloroplasts and broad vacuole-like spaces (Elodea); the chloroplast TEM shows the organelle outline and internal membrane stacks, not a whole cell. The cheek micrograph supports nucleus, cytoplasm and a visible boundary. The animal TEM shows part of a mammalian cell with nucleus, rough endoplasmic reticulum and mitochondria; it does not show a whole cell or establish species or health. The E. coli SEM shows external rods and its 2.00 µm scale only. The bacterial TEM shows cell outlines and cytoplasm in a different species, but its electron-light/dense particles are not identified as DNA, plasmids, ribosomes or other specific structures. These are explicit limits on individual images: use only source-supported labels, and do not expect every photograph to show every structure.
What to do in an assessment
- Use each actual image in unlabelled practice mode, then reveal its key and compare with the schematic gallery. The paired image and schematic practice covers Core 3 recognition in actual images and diagrams. Distinguish visible structures from source/key limits; do not infer DNA, plasmids or ribosomes from the bacterial TEM arrows, or infer species/health from the animal TEM.
In plain language
Practice identifying cell structures in both real images and diagrams, while using each image only for features it actually resolves.
Self-check
How should you use the actual cell micrographs/TEMs alongside the schematic figures?
Show the answer
Practice recognition in both forms: use diagrams for schematic structure identification and identify only the structures supported by each real image. The chloroplast TEM is an organelle detail, the animal TEM shows only part of a cell, E. coli SEM shows external rods, and the bacterial TEM particles are not identified as DNA, plasmids or ribosomes. These limits prevent over-labelling; they do not require every structure to appear in every photo.
View diagrams
Companion photograph
Practice question
Compare the two plant-cell micrographs. In the onion epidermis, what are the clear outer boundaries and dark spots? In the Elodea leaf cells, what are the many green bodies, and what do the broad clear central regions resemble?
Photograph / micrograph recognition only. Neither image separately resolves the plasma membrane from the cell wall. Onion cytoplasm and vacuole are not distinguishable here; the Elodea cytoplasm and any nucleus are not clearly resolved. Do not claim the Elodea photo shows a nucleus.
Photo: Onion skin cells under a microscope · Katekor1Stained Allium cepa (onion) epidermis light micrograph.Photo: Chloroplasts - Microscopic view of Elodea canadensis · Juan Carlos Fonseca MataElodea canadensis leaf cells; source identifies chloroplasts.Show labelled key: Answer key for plant-cell-micrographs
Plant cells: onion epidermis and Elodea leaf
Chloroplasts - Microscopic view of Elodea canadensis
Photo key
The onion epidermis shows cell walls and nuclei. The Elodea leaf micrograph shows cell walls, many chloroplasts, and broad clear central regions consistent with vacuoles. The onion bulb epidermis does not normally contain chloroplasts. A nucleus is not clearly resolved in the Elodea image.
Neither image separately resolves the plasma membrane from the cell wall. Onion cytoplasm and vacuole are not distinguishable here; the Elodea cytoplasm and any nucleus are not clearly resolved. Do not claim the Elodea photo shows a nucleus.
Photo: Onion skin cells under a microscope · Katekor1Stained Allium cepa (onion) epidermis light micrograph.Photo: Chloroplasts - Microscopic view of Elodea canadensis · Juan Carlos Fonseca MataElodea canadensis leaf cells; source identifies chloroplasts.Practice question
In the clearest central cheek cell, identify the purple-stained structure, the pale interior, and the visible outer cell boundary.
Photograph / micrograph recognition only. This is a real microscope photograph of a human cheek-cell sample, not a model. The cell surface membrane cannot be distinguished separately from the outer boundary. The image has no scale bar and the source gives no stain information.
Photo: Human cheek cells from science class · KyrebSource describes a microscope photograph of the photographer’s own inner-cheek sample.Show labelled key: Answer key for animal-cell-micrograph
Human cheek-cell micrograph
Photo key
The purple-stained structure is the nucleus; the pale interior is cytoplasm. The cell boundary is visible, but the membrane is not separately resolved as a bilayer.
This is a real microscope photograph of a human cheek-cell sample, not a model. The cell surface membrane cannot be distinguished separately from the outer boundary. The image has no scale bar and the source gives no stain information.
Photo: Human cheek cells from science class · KyrebSource describes a microscope photograph of the photographer’s own inner-cheek sample.Practice question
What overall shape do the visible bacteria have? What does the scale annotation help you estimate?
Photograph / micrograph recognition only. The organism is identified by the source as cultured E. coli. This SEM does not reveal internal structures. Use the bacterial-cell schematic for cell contents; do not label DNA or plasmids on this photograph.
Photo: E. coli Bacteria (7316101966) · NIAIDScanning electron micrograph; the original image includes a 2.00 µm scale annotation.Show labelled key: Answer key for bacterial-cell-micrograph
E. coli scanning electron micrograph
Photo key
The image shows rod-shaped Escherichia coli. The printed scale annotation represents 2.00 µm. This scanning electron micrograph shows the outer form only; it does not show cytoplasm, DNA, a nucleoid, or plasmids.
The organism is identified by the source as cultured E. coli. This SEM does not reveal internal structures. Use the bacterial-cell schematic for cell contents; do not label DNA or plasmids on this photograph.
Photo: E. coli Bacteria (7316101966) · NIAIDScanning electron micrograph; the original image includes a 2.00 µm scale annotation.Practice question
In this TEM detail, identify the organelle outline and the repeated internal membrane stacks. What scale is shown?
Photograph / micrograph recognition only. The source names Anemone only as sp.; no exact species is identified. This image does not show a whole cell, cell wall, nucleus, or broad cytoplasm. Individual membrane bilayers are not resolved.
Photo: Chloroplast in leaf of Anemone sp TEM 12000x · And3k and Caper437TEM source page gives 12,000× magnification and a 1 µm scale bar.Show labelled key: Answer key for plant-chloroplast-tem
Chloroplast TEM
Photo key
This is a chloroplast from an Anemone sp. leaf cell. The organelle outline and internal membrane stacks are visible; the scale bar is 1 µm. The image shows an organelle detail, not a whole cell.
The source names Anemone only as sp.; no exact species is identified. This image does not show a whole cell, cell wall, nucleus, or broad cytoplasm. Individual membrane bilayers are not resolved.
Photo: Chloroplast in leaf of Anemone sp TEM 12000x · And3k and Caper437TEM source page gives 12,000× magnification and a 1 µm scale bar.Practice question
Use relative position and appearance in this thin section to identify the visible part of the nucleus, rough endoplasmic reticulum, and mitochondria.
Photograph / micrograph recognition only. The source does not identify the mammal or establish donor health status. Only part of the cell is shown; the complete cell outline and surface membrane are not present.
Photo: Clara cell lung - TEM · Louisa Howard; Dartmouth Electron Microscope FacilityMammalian lung TEM collection.Source provenance: Dartmouth Electron Microscope FacilityShow labelled key: Answer key for animal-cell-tem
Mammalian bronchiolar club-cell TEM
Photo key
The source identifies part of the nucleus, rough endoplasmic reticulum, and mitochondria in the cytoplasm of a mammalian bronchiolar club (Clara) cell. A 500 nm scale bar is visible; the full cell boundary is outside this frame.
The source does not identify the mammal or establish donor health status. Only part of the cell is shown; the complete cell outline and surface membrane are not present.
Photo: Clara cell lung - TEM · Louisa Howard; Dartmouth Electron Microscope FacilityMammalian lung TEM collection.Source provenance: Dartmouth Electron Microscope FacilityPractice question
Compare the cell outlines and internal contrast across panels A-C. What can be said about the arrow-marked regions without assigning them an organelle identity?
Photograph / micrograph recognition only. This is a different bacterium from E. coli. Do not use its arrows to claim that DNA, plasmids, or ribosomes are resolved. The source panels show cells under differing growth conditions.
Photo: Fmicb-03-00345-g005 · Ahmad F. Khadem, Muriel C. F. van Teeseling, Laura van Niftrik, Mike S. M. Jetten, Huub J. M. Op den Camp, and Arjan PolThree TEM panels with 200 nm scale bars.Show labelled key: Answer key for bacterial-cell-tem
Methylacidiphilum fumariolicum TEM panels
Photo key
These are chemically fixed, thin-sectioned Methylacidiphilum fumariolicum cells from different growth phases. Cell outlines and cytoplasm are visible; the arrows mark electron-light and electron-dense particles. The source does not identify these particles as DNA, plasmids, ribosomes, or other specific structures.
This is a different bacterium from E. coli. Do not use its arrows to claim that DNA, plasmids, or ribosomes are resolved. The source panels show cells under differing growth conditions.
Photo: Fmicb-03-00345-g005 · Ahmad F. Khadem, Muriel C. F. van Teeseling, Laura van Niftrik, Mike S. M. Jetten, Huub J. M. Op den Camp, and Arjan PolThree TEM panels with 200 nm scale bars.Actual micrograph and TEM practice: identify only features named or resolved in each source image; respect the organelle/partial-cell views and do not assign identities to unlabelled bacterial particles. - Course content
Scope: Course content · Subject-content route: any of Core, Extended (Core and Supplement) · §3 Topic 7 §7.2 Core 1(a–b) — actual-image identification of alimentary-canal and accessory digestive organs, distinct from schematic diagrams.
Open revision guidance
What to know
- The Blausen 3D medical illustration is a real sourced image with printed labels for the mouth, salivary glands, oesophagus (printed “Esophagus”), stomach, liver, gallbladder, pancreas, small and large intestine, and anus. Use it for actual-image recognition of those named structures, paired with the full alimentary-system schematic and key for the complete source-target practice. The illustration does not separately label finer divisions such as the duodenum, ileum, colon or rectum; these are practised on the schematic. The torso-model photograph is optional contrast only and cannot reliably identify named digestive organs.
What to do in an assessment
- Inspect the printed labels on the Blausen image and match each named organ to its position; read printed “Esophagus” as syllabus “oesophagus.” Then cover and practise the same source targets on the paired full alimentary-system schematic before revealing its key, including finer divisions not separately labelled in the Blausen image. The torso model is contrast only, not evidence for naming individual organs.
In plain language
Practise named-organ recognition on the labelled Blausen 3D image and use the full schematic for finer digestive structures; the torso model is only a contrast image.
Self-check
How do the labelled Blausen 3D image and the full alimentary schematic work together for recognition practice?
Show the answer
The Blausen image provides a sourced, labelled real-image view of the mouth, salivary glands, oesophagus, stomach, liver, gallbladder, pancreas, small and large intestine, and anus. Use the full schematic and key for the complete source-target practice, including finer divisions not separately labelled on the image. Do not use the torso model to name organs.
View diagrams
Digestive system: Blausen medical illustration
Practice question
Use the printed organ labels in this medical illustration to describe the route food follows from the mouth through the pharynx and oesophagus, stomach, small intestine and large intestine to the anus. Which organ makes bile and which stores it? This broad view does not individually label the duodenum, ileum, colon or rectum; compare it with the full digestive-system schematic for practice with those detailed labels.
Medical-illustration recognition only. Blausen medical illustration, not a photograph, patient image or clinical image. The printed labels are part of the source artwork and remain visible; this is not an unlabelled recall exercise. Duodenum, ileum, colon and rectum are not individually labelled in this illustration.
Illustration: Blausen 0316: Digestive System · BruceBlaus and Blausen.com staff (2014)3D medical illustration; original artwork includes printed organ labels.Show labelled key: Answer key for digestive-system-illustration
Digestive system: Blausen medical illustration
Illustration key
The labelled route is mouth → pharynx → oesophagus → stomach → small intestine → large intestine → anus (the rectum lies before the anus but is not individually labelled here). The liver makes bile; the gallbladder stores and concentrates it. Use the full digestive-system schematic to identify the duodenum and ileum within the small intestine and the colon and rectum within the large intestine.
Blausen medical illustration, not a photograph, patient image or clinical image. The printed labels are part of the source artwork and remain visible; this is not an unlabelled recall exercise. Duodenum, ileum, colon and rectum are not individually labelled in this illustration.
Illustration: Blausen 0316: Digestive System · BruceBlaus and Blausen.com staff (2014)3D medical illustration; original artwork includes printed organ labels.Human digestive systemSimplified schematic; not to scale. - A
- B
- C
- D
- E
- F
- G
- H
- I
- J
- K
- L
- M
Show labelled key: Answer key for digestive-system
Human digestive systemSimplified schematic; not to scale. - AMouth
- BOesophagus
- CLiver
- DGall bladder
- EStomach
- FPancreas
- GDuodenum
- HIleum
- IColon
- JRectum
- KAnus
- LSalivary glands
- MBile duct
Practice question
What can this photograph reliably identify about the image itself? Why is it not sufficient for identifying specific digestive organs?
Photograph / micrograph recognition only. Not a patient photograph, clinical specimen, or generated illustration. This photograph does not reliably support identifying the pancreas, gallbladder, duodenum, or ileum. Use the paired digestive-system medical illustration for the broad organs and the full schematic for detailed subdivisions.
Photo: Anatomical Moulages (Torso) · RealmasteryPhotograph of physical anatomical torso models in a medical-school moulage room.Show labelled key: Answer key for digestive-model-photo
Partial torso-model photograph
Photo key
It is a photograph of physical anatomical torso teaching models with cutaway views. The source notes that abdominal organs are represented, but this mixed-system frame does not individually label them or reliably support naming specific digestive organs. It remains a partial resource, not a digestive-organ recognition figure.
Not a patient photograph, clinical specimen, or generated illustration. This photograph does not reliably support identifying the pancreas, gallbladder, duodenum, or ileum. Use the paired digestive-system medical illustration for the broad organs and the full schematic for detailed subdivisions.
Photo: Anatomical Moulages (Torso) · RealmasteryPhotograph of physical anatomical torso models in a medical-school moulage room.Sourced labelled Blausen 3D digestive-system image paired with the full alimentary schematic and key; finer divisions are practised on the schematic. Torso-model photo is optional contrast. - Course content
Scope: Course content · Subject-content route: any of Core, Extended (Core and Supplement) · §3 Topic 7 §7.3 Core 3 — actual-image identification of incisors, canines, premolars and molars, distinct from schematic diagrams.
Open revision guidance
What to know
- Inspect both physical jaw models: incisors are the front teeth, pointed canines sit at the corners, premolars lie behind the canines, and the broad, multi-cusped molars are farthest back. The upper and lower occlusal views provide usable actual-image recognition practice for all four classes by crown shape and position.
What to do in an assessment
- In each unlabelled occlusal photograph, trace the arch from the front toward the back and identify incisors, canines, premolars and molars using both crown shape and position. Reveal the photo key after attempting each view.
In plain language
The upper and lower jaw-model photos clearly support recognition of all four tooth classes by shape and position.
Self-check
Starting at the front of either jaw model, what is the order of the four tooth classes, and which features help distinguish them?
Show the answer
Incisors, canines, premolars, then molars. Their front-to-back positions and crown forms distinguish the classes: incisors have cutting edges, canines are pointed, premolars sit behind canines, and broad multi-cusped molars are farthest back.
View diagrams
Companion photograph
Practice question
Using the crown shapes and front-to-back positions in the upper and lower jaw models, identify the four tooth classes and describe their order around the arch.
Photograph / micrograph recognition only. These are physical models, not specimens or clinical images. Tooth-class recognition is based on visible crown form and position. No scale bar is shown.
Photo: Upper jaw · Håkan Svensson (Xauxa)Top/occlusal photograph of a physical upper-jaw teaching model.Photo: Lower jaw · Håkan Svensson (Xauxa)Top/occlusal photograph of a physical lower-jaw teaching model.Show labelled key: Answer key for dentition-model-photo
Upper and lower jaw occlusal teaching models
Lower jaw
Photo key
The front teeth are incisors; canines sit just behind them at the corners; premolars lie behind the canines; molars are farthest back. Both images are occlusal (top) views of physical teaching models, and the class names are not printed on the teeth.
These are physical models, not specimens or clinical images. Tooth-class recognition is based on visible crown form and position. No scale bar is shown.
Photo: Upper jaw · Håkan Svensson (Xauxa)Top/occlusal photograph of a physical upper-jaw teaching model.Photo: Lower jaw · Håkan Svensson (Xauxa)Top/occlusal photograph of a physical lower-jaw teaching model.Upper- and lower-jaw occlusal model photos: practice all four tooth classes using visible crown shape and front-to-back position.
Earlier topic checklist
These earlier topic ticks are separate from the reviewed points above and do not count towards that progress.
Biology topic list
Tick each item off as you revise. Ticks are saved on this device only.
These ticks keep your earlier topic checklist. They do not count towards the new reviewed requirements above. Its numbering may be internal; use the linked references above for the exact reviewed source requirements.
Foundation tier topics
Higher tier topics
How OmniStudy helps you revise
- Answer exam-style questions on any topic below and get marked in seconds, with feedback on how to win more marks.
- Flashcards, quizzes and revision games generated for every topic.
- Practise real past papers with mark schemes.
- A study planner with an exam countdown, built around your weakest topics.
- Everything works in English and Welsh.
Ready to start?
Free to start. Pick your subject, answer a question, and see your first mark in minutes.
Start revising free