
WJEC GCSE Biology Revision
Explore WJEC GCSE Biology revision topics. Check the official specification for complete requirements for your exam year and route.
Course details
Assessment For 2027, two 1 hour 45 minutes written papers each contribute 45%, with Foundation or Higher chosen separately for each unit, and an untiered 30-mark practical assessment contributes 10%.
Tick a point after revising it. Progress is saved on this device and does not measure mastery.
Reviewed course guidance
Revision points, with the explanation beside them
Open a point to read what to know, how to use it in an assessment, a plain-language explanation and a self-check. Answers stay hidden until you choose to reveal them.
Options and source
Unit 1 examination tier
- Foundation Tier
- Higher Tier
Unit 2 examination tier
- Foundation Tier
- Higher Tier
Progress could not be saved in this browser. Your ticks will remain for this page view only.
Topic group
Cell as a working unit
- Core
Scope: Core · §2.1 Unit 1, 1.1 Cells and movement across membranes
Open revision guidance
What to know
- Animal and plant eukaryotic cells have a cell-surface membrane, cytoplasm, ribosomes and a nucleus. The membrane controls movement into and out of the cell; cytoplasm is where many chemical reactions occur; the nucleus contains genetic material and controls cell activities; ribosomes make proteins; mitochondria are where aerobic respiration releases energy.
- Plant cells also have a cellulose cell wall for support, chloroplasts with chlorophyll for photosynthesis and a large permanent vacuole containing cell sap that helps maintain cell firmness. Bacterial cells are smaller prokaryotes: circular DNA lies free in cytoplasm, some have plasmids, and a cell wall is present; they lack a nucleus and membrane-bound organelles.
- Cells form tissues, tissues form organs, organs form organ systems and these form an organism. Structures should be identified from labelled diagrams and actual cell micrographs, using only features visible at the available resolution.
What to do in an assessment
- On an animal/plant cell diagram identify membrane, cytoplasm, nucleus, mitochondria, ribosomes and (in plants) wall, chloroplasts and vacuole; distinguish bacterial free circular DNA from a eukaryotic nucleus.
- Identify supported structures from the gallery’s schematic and micrograph evidence; do not infer invisible structures.
In plain language
On an animal/plant cell diagram identify membrane, cytoplasm, nucleus, mitochondria, ribosomes and (in plants) wall, chloroplasts and vacuole; distinguish bacterial free circular DNA from a eukaryotic nucleus.; Identify supported structures from the gallery’s schematic and micrograph evidence; do not infer invisible structures.
Self-check
A micrograph shows a cell wall, chloroplasts and a nucleus. Which cell type is best supported, and what is the evidence?
Show the answer
A plant eukaryotic cell: the nucleus identifies a eukaryote, while the wall and chloroplasts are plant-cell structures.
View diagrams
Plant cell · Unlabelled practice · Schematic, simplified and not to scale. Show labelled key: Answer key for plant-cell
Plant cell · Structure key · Schematic, simplified and not to scale. Animal cell · Unlabelled practice · Schematic, simplified and not to scale. Show labelled key: Answer key for animal-cell
Animal cell · Structure key · Schematic, simplified and not to scale. Bacterial cell · Unlabelled practice · Schematic, simplified and not to scale. Show labelled key: Answer key for bacterial-cell
Bacterial cell · Structure key · Schematic, simplified and not to scale. 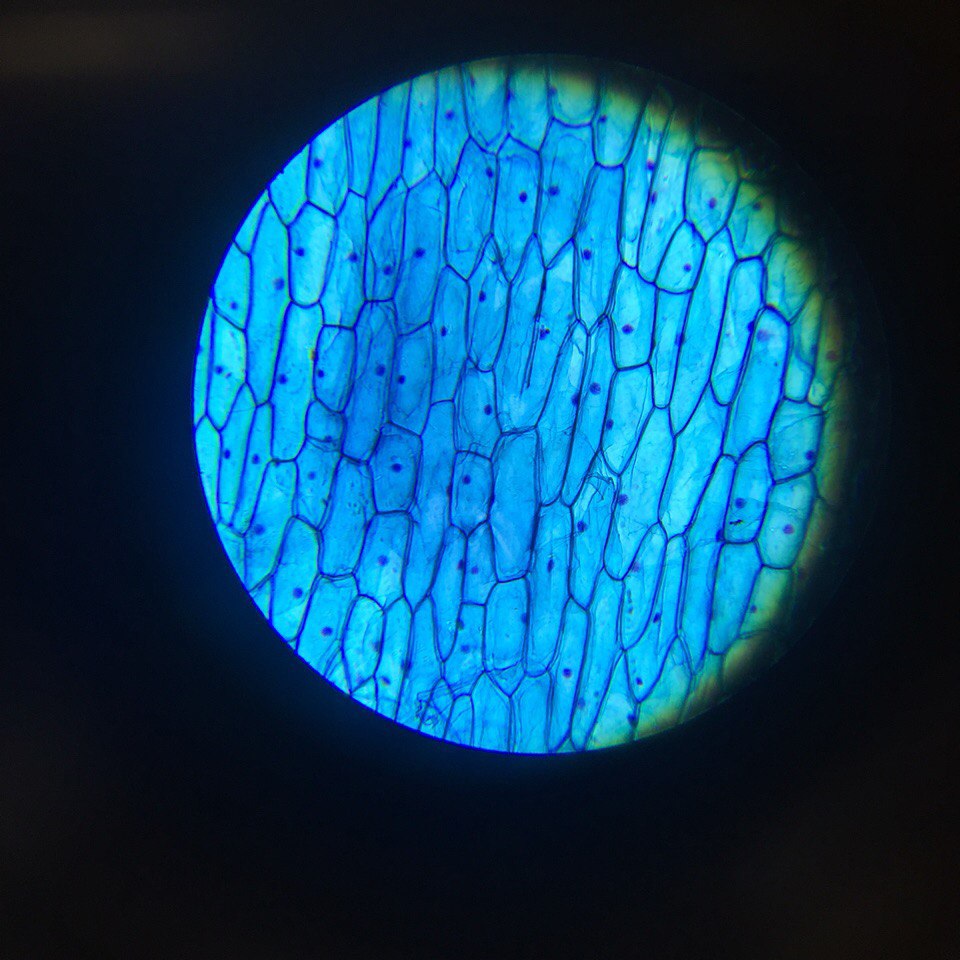
Companion photograph
Practice question
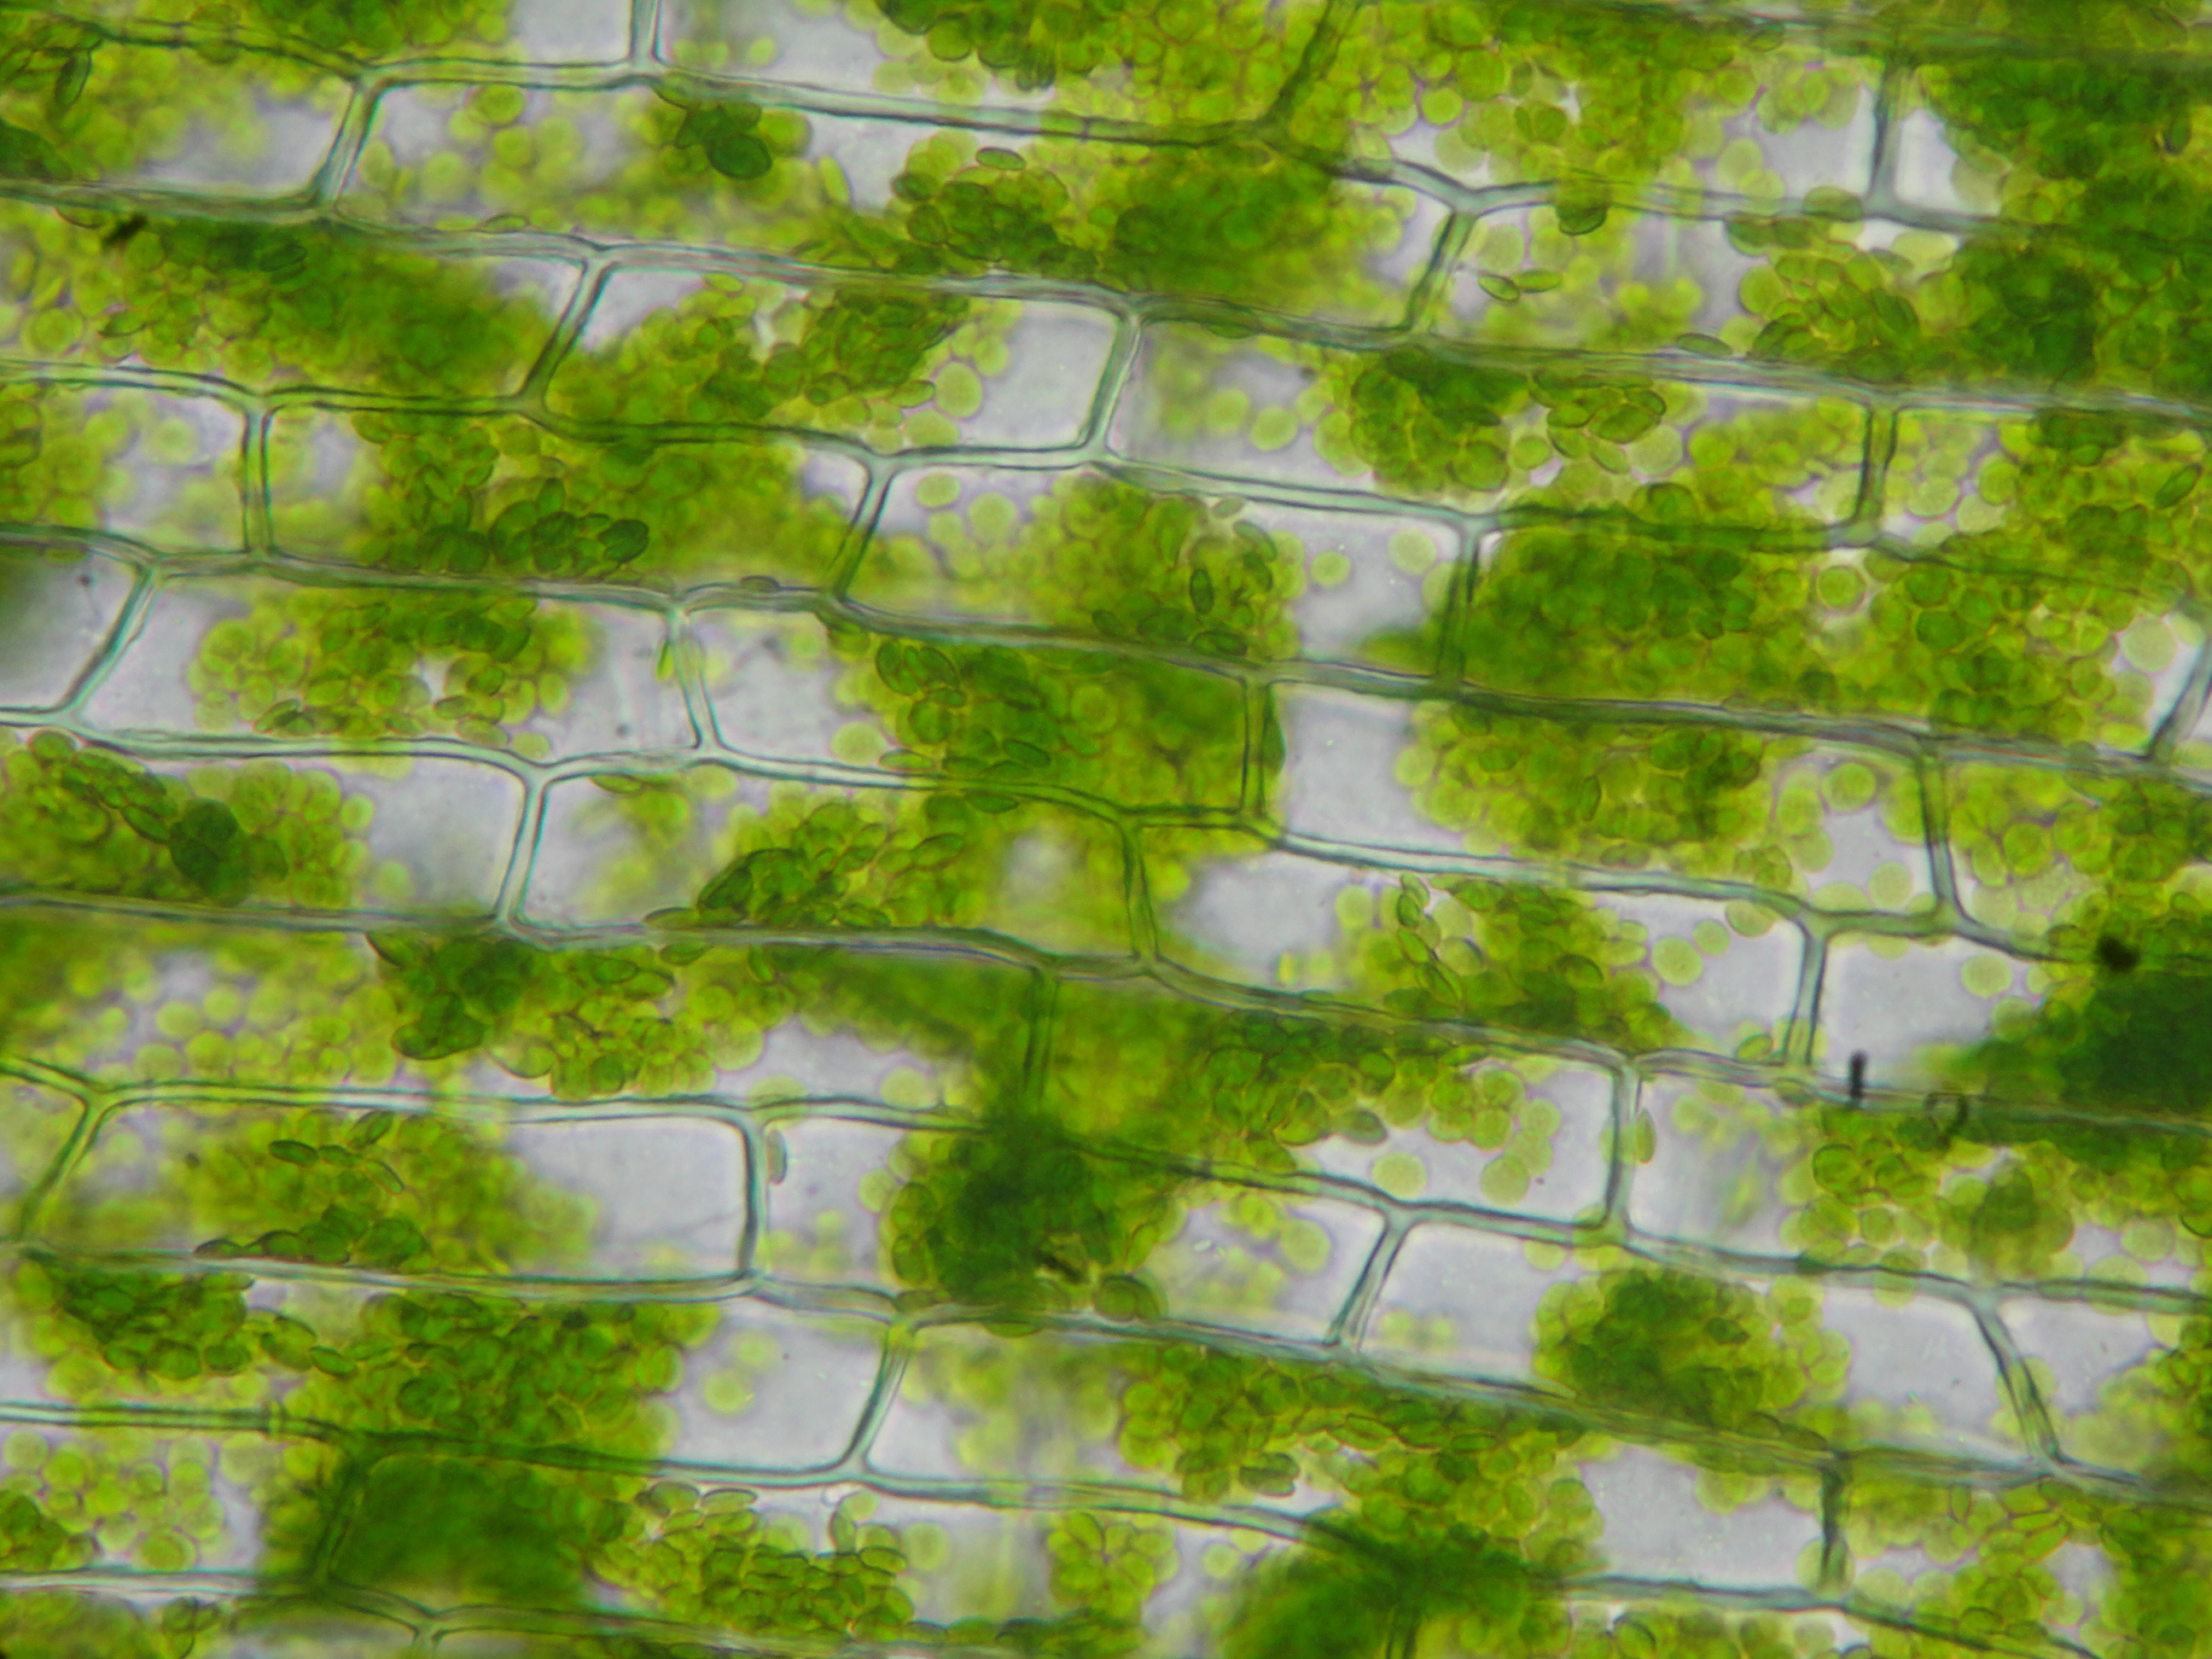
Compare the two plant-cell micrographs. In the onion epidermis, what are the clear outer boundaries and dark spots? In the Elodea leaf cells, what are the many green bodies, and what do the broad clear central regions resemble?
Photograph / micrograph recognition only. Neither image separately resolves the plasma membrane from the cell wall. Onion cytoplasm and vacuole are not distinguishable here; the Elodea cytoplasm and any nucleus are not clearly resolved. Do not claim the Elodea photo shows a nucleus.
Photo: Onion skin cells under a microscope · Katekor1Stained Allium cepa (onion) epidermis light micrograph.Photo: Chloroplasts - Microscopic view of Elodea canadensis · Juan Carlos Fonseca MataElodea canadensis leaf cells; source identifies chloroplasts.Show labelled key: Answer key for plant-cell-micrographs
Plant cells: onion epidermis and Elodea leaf
Chloroplasts - Microscopic view of Elodea canadensis
Photo key
The onion epidermis shows cell walls and nuclei. The Elodea leaf micrograph shows cell walls, many chloroplasts, and broad clear central regions consistent with vacuoles. The onion bulb epidermis does not normally contain chloroplasts. A nucleus is not clearly resolved in the Elodea image.
Neither image separately resolves the plasma membrane from the cell wall. Onion cytoplasm and vacuole are not distinguishable here; the Elodea cytoplasm and any nucleus are not clearly resolved. Do not claim the Elodea photo shows a nucleus.
Photo: Onion skin cells under a microscope · Katekor1Stained Allium cepa (onion) epidermis light micrograph.Photo: Chloroplasts - Microscopic view of Elodea canadensis · Juan Carlos Fonseca MataElodea canadensis leaf cells; source identifies chloroplasts.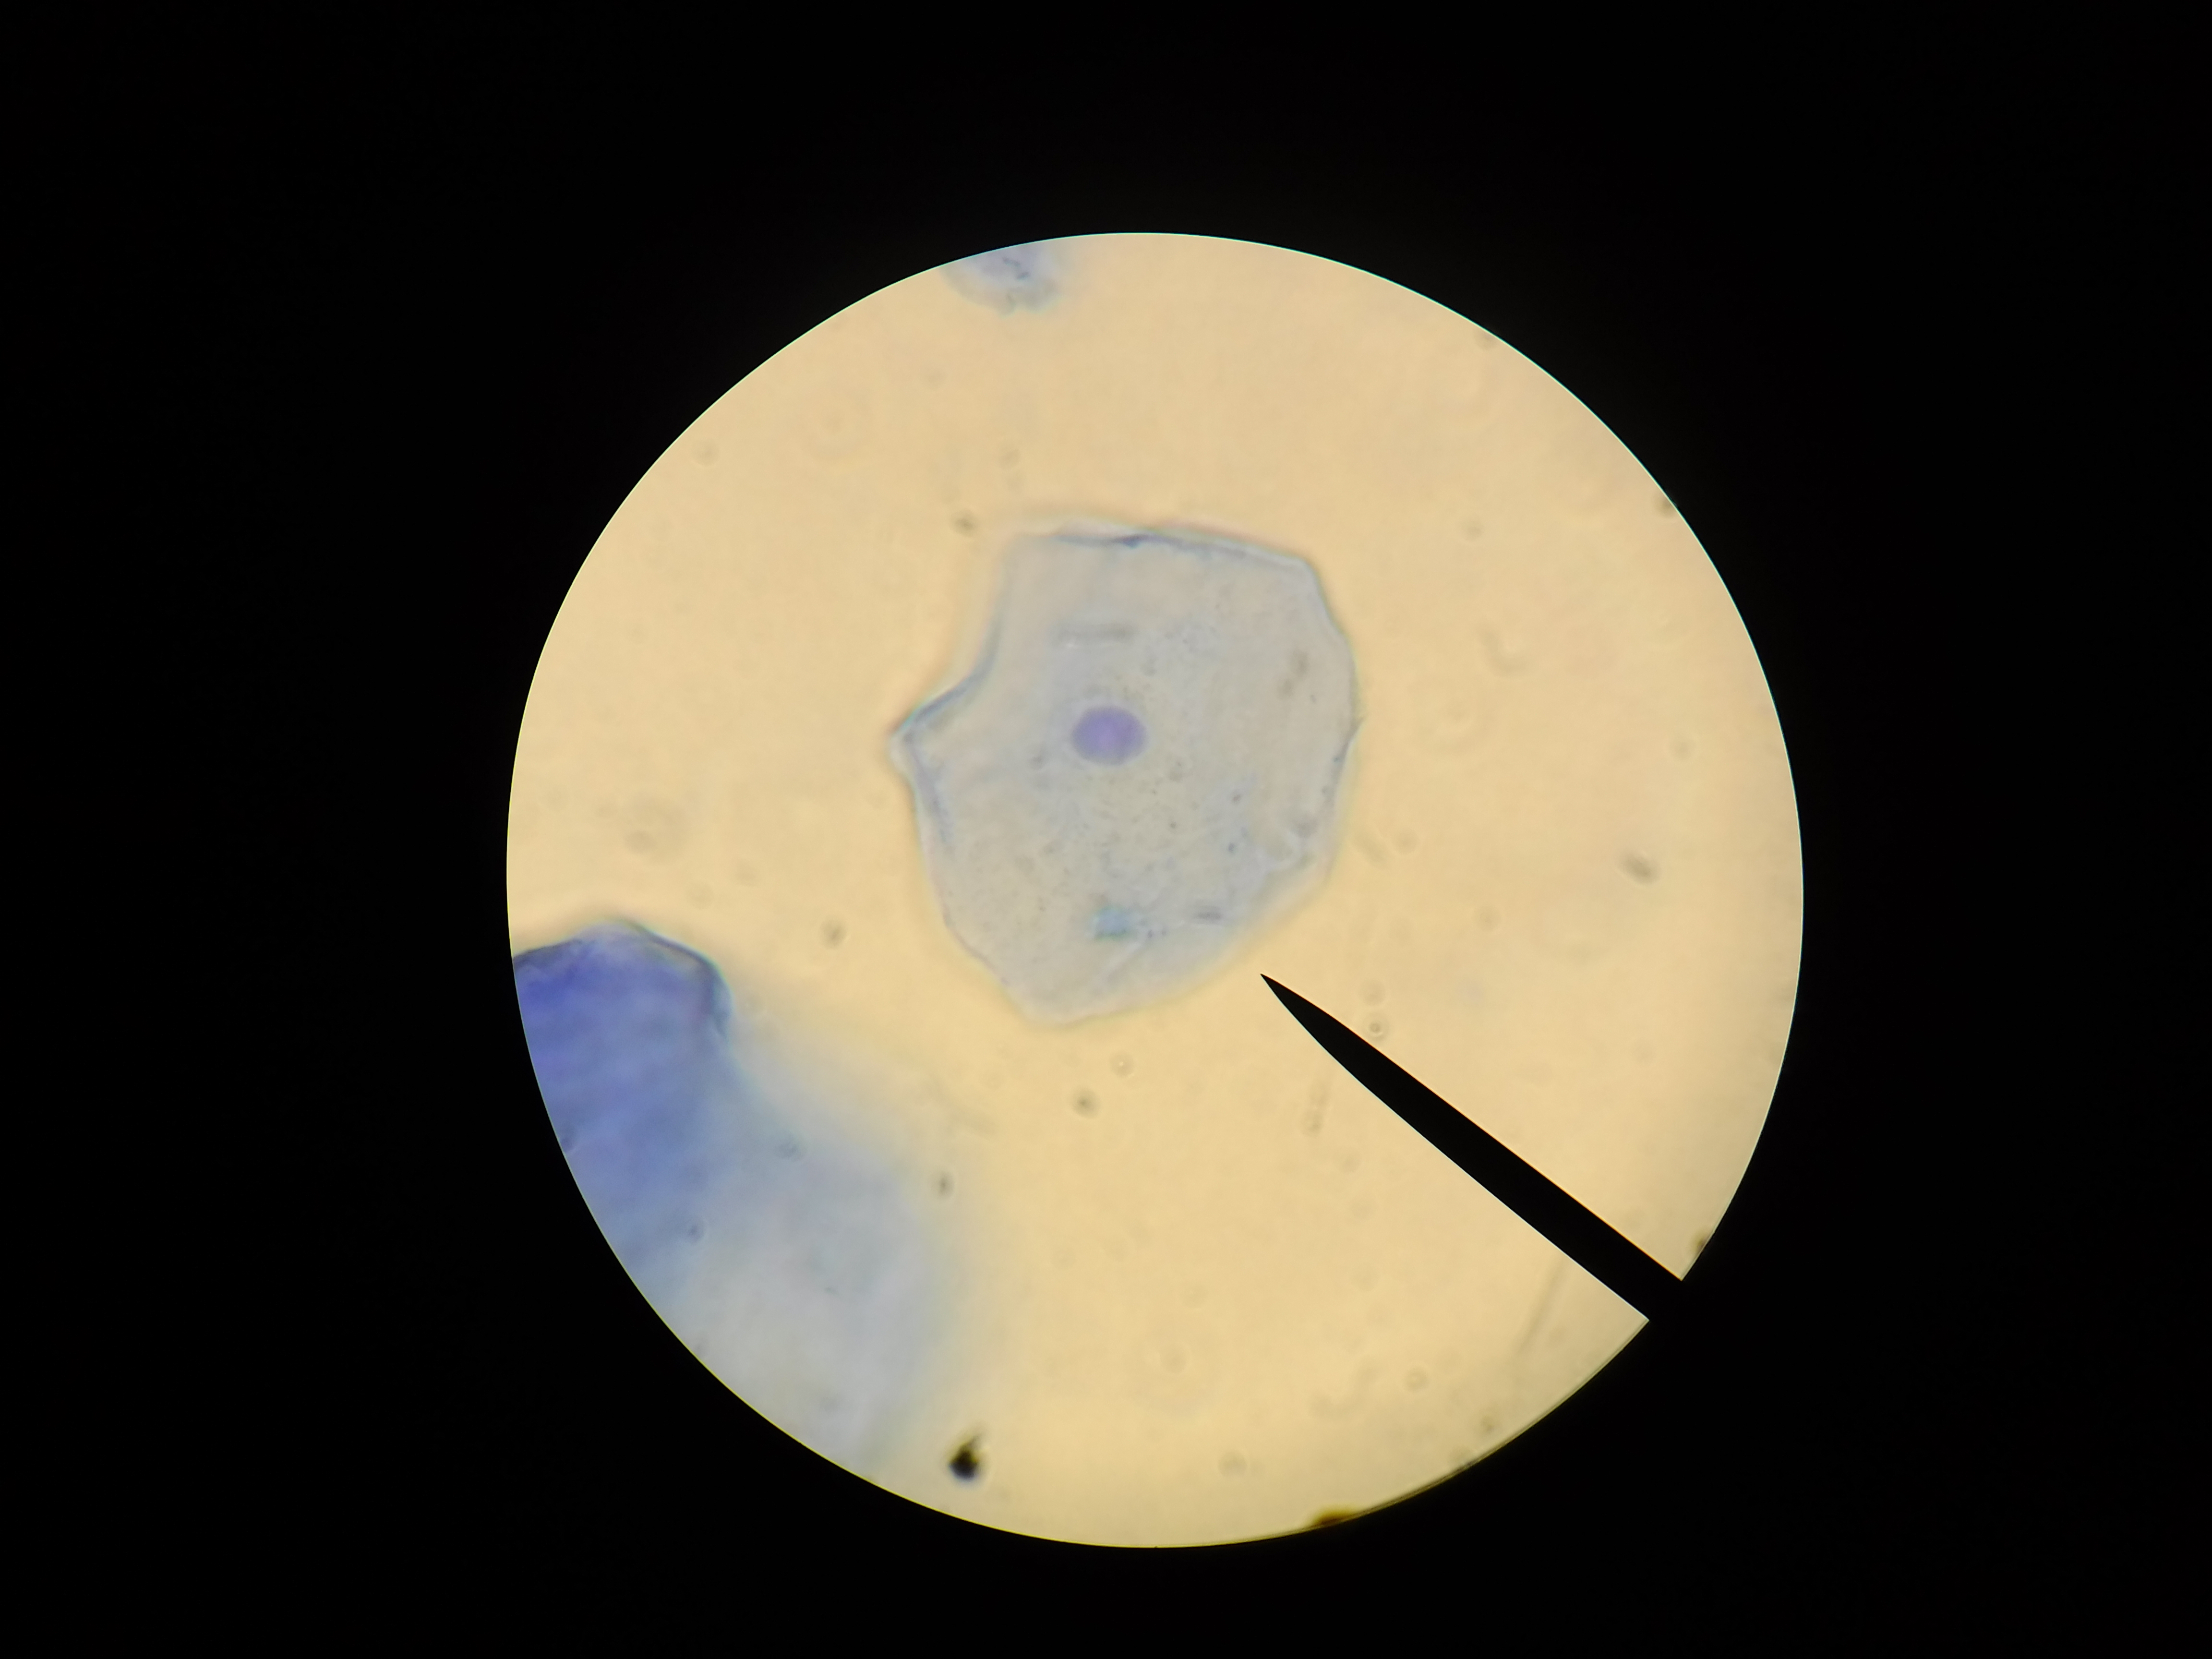
Practice question
In the clearest central cheek cell, identify the purple-stained structure, the pale interior, and the visible outer cell boundary.
Photograph / micrograph recognition only. This is a real microscope photograph of a human cheek-cell sample, not a model. The cell surface membrane cannot be distinguished separately from the outer boundary. The image has no scale bar and the source gives no stain information.
Photo: Human cheek cells from science class · KyrebSource describes a microscope photograph of the photographer’s own inner-cheek sample.Show labelled key: Answer key for animal-cell-micrograph
Human cheek-cell micrograph
Photo key
The purple-stained structure is the nucleus; the pale interior is cytoplasm. The cell boundary is visible, but the membrane is not separately resolved as a bilayer.
This is a real microscope photograph of a human cheek-cell sample, not a model. The cell surface membrane cannot be distinguished separately from the outer boundary. The image has no scale bar and the source gives no stain information.
Photo: Human cheek cells from science class · KyrebSource describes a microscope photograph of the photographer’s own inner-cheek sample.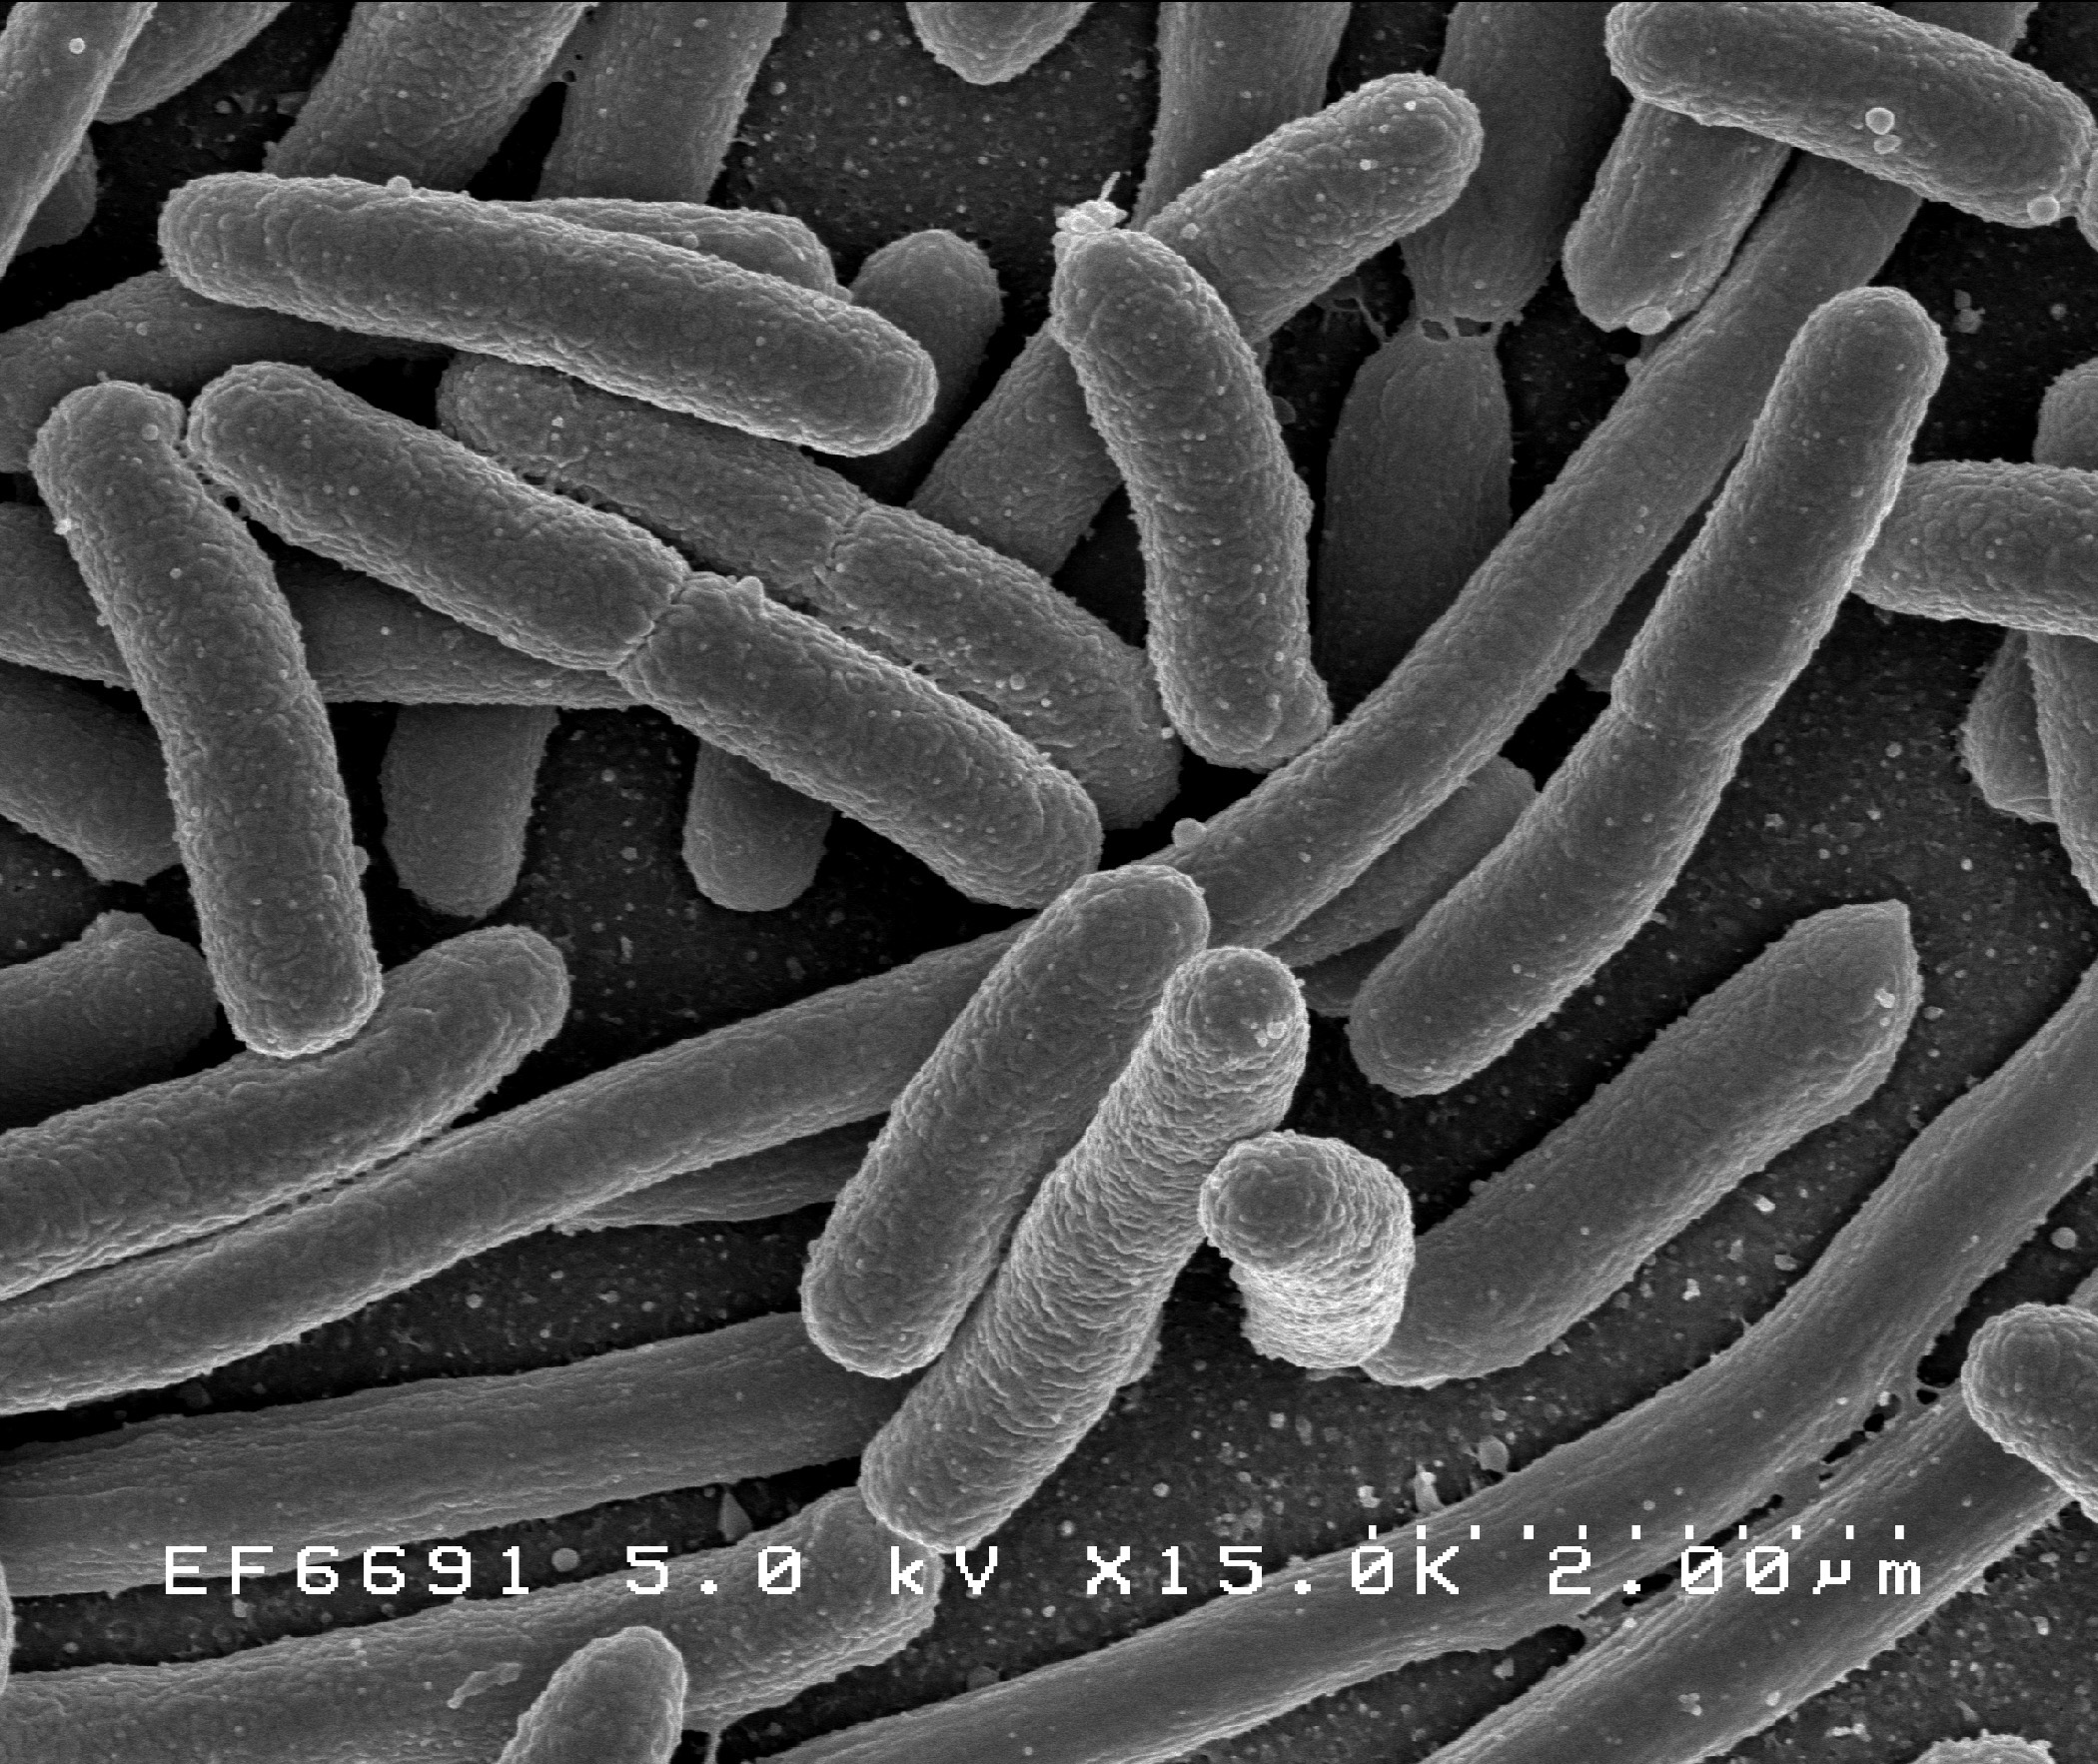
Practice question
What overall shape do the visible bacteria have? What does the scale annotation help you estimate?
Photograph / micrograph recognition only. The organism is identified by the source as cultured E. coli. This SEM does not reveal internal structures. Use the bacterial-cell schematic for cell contents; do not label DNA or plasmids on this photograph.
Photo: E. coli Bacteria (7316101966) · NIAIDScanning electron micrograph; the original image includes a 2.00 µm scale annotation.Show labelled key: Answer key for bacterial-cell-micrograph
E. coli scanning electron micrograph
Photo key
The image shows rod-shaped Escherichia coli. The printed scale annotation represents 2.00 µm. This scanning electron micrograph shows the outer form only; it does not show cytoplasm, DNA, a nucleoid, or plasmids.
The organism is identified by the source as cultured E. coli. This SEM does not reveal internal structures. Use the bacterial-cell schematic for cell contents; do not label DNA or plasmids on this photograph.
Photo: E. coli Bacteria (7316101966) · NIAIDScanning electron micrograph; the original image includes a 2.00 µm scale annotation.Practise labelling the schematic cells and identifying evidence in authentic micrographs; use only structures visible at the image resolution.
Topic group
Specialisation and scale
- Core
Scope: Core · §2.1 Unit 1, 1.1 Cells and movement across membranes
Open revision guidance
What to know
- Differentiation produces specialised cells whose structures suit their function. Red blood cells are biconcave and contain haemoglobin; root-hair cells have a long extension; sperm cells have a flagellum and many mitochondria.
- Magnification = image size ÷ actual size. Convert both lengths to the same unit first; 1 mm = 1000 µm. Magnification has no unit.
What to do in an assessment
- For an image or diagram, match each named specialised-cell feature to the task it helps perform.
- For microscopy calculations, convert to matching units, divide image size by actual size, and state magnification without a unit; rearrange actual size = image size ÷ magnification.
In plain language
For an image or diagram, match each named specialised-cell feature to the task it helps perform.; For microscopy calculations, convert to matching units, divide image size by actual size, and state magnification without a unit; rearrange actual size = image size ÷ magnification.
Self-check
A 40 µm cell is drawn 8 mm long. What is its magnification?
Show the answer
Convert 8 mm to 8000 µm; 8000 ÷ 40 = ×200.
Topic group
Microscopy and evidence
- Core
Scope: Core · §2.1 Unit 1, 1.1 Cells and movement across membranes; specified microscopy practical; Appendix C mathematical requirements
Open revision guidance
What to know
- A light microscope can be used to observe cells; resolution determines how much detail can be distinguished. A biological drawing records the observed structures and proportions rather than artistic shading.
- When using a scale bar, compare the measured image length with the scale-bar image length; include units in a size calculation and keep labels clear.
What to do in an assessment
- Focus on low power first, prepare a thin specimen, then increase magnification; draw with clear single lines, correct relative proportions and label structures actually visible.
- State magnification or scale evidence and do not infer an organelle the instrument cannot resolve.
In plain language
Focus on low power first, prepare a thin specimen, then increase magnification; draw with clear single lines, correct relative proportions and label structures actually visible.; State magnification or scale evidence and do not infer an organelle the instrument cannot resolve.
Self-check
A scale bar representing 10 µm measures 20 mm on a printed image. A cell measures 30 mm. What is its actual length?
Show the answer
The cell is 30 ÷ 20 × 10 = 15 µm long; compare image lengths in the same units before multiplying by the represented scale.
View diagrams
Companion photograph
Practice question
Compare the two plant-cell micrographs. In the onion epidermis, what are the clear outer boundaries and dark spots? In the Elodea leaf cells, what are the many green bodies, and what do the broad clear central regions resemble?
Photograph / micrograph recognition only. Neither image separately resolves the plasma membrane from the cell wall. Onion cytoplasm and vacuole are not distinguishable here; the Elodea cytoplasm and any nucleus are not clearly resolved. Do not claim the Elodea photo shows a nucleus.
Photo: Onion skin cells under a microscope · Katekor1Stained Allium cepa (onion) epidermis light micrograph.Photo: Chloroplasts - Microscopic view of Elodea canadensis · Juan Carlos Fonseca MataElodea canadensis leaf cells; source identifies chloroplasts.Show labelled key: Answer key for plant-cell-micrographs
Plant cells: onion epidermis and Elodea leaf
Chloroplasts - Microscopic view of Elodea canadensis
Photo key
The onion epidermis shows cell walls and nuclei. The Elodea leaf micrograph shows cell walls, many chloroplasts, and broad clear central regions consistent with vacuoles. The onion bulb epidermis does not normally contain chloroplasts. A nucleus is not clearly resolved in the Elodea image.
Neither image separately resolves the plasma membrane from the cell wall. Onion cytoplasm and vacuole are not distinguishable here; the Elodea cytoplasm and any nucleus are not clearly resolved. Do not claim the Elodea photo shows a nucleus.
Photo: Onion skin cells under a microscope · Katekor1Stained Allium cepa (onion) epidermis light micrograph.Photo: Chloroplasts - Microscopic view of Elodea canadensis · Juan Carlos Fonseca MataElodea canadensis leaf cells; source identifies chloroplasts.Practice question
In the clearest central cheek cell, identify the purple-stained structure, the pale interior, and the visible outer cell boundary.
Photograph / micrograph recognition only. This is a real microscope photograph of a human cheek-cell sample, not a model. The cell surface membrane cannot be distinguished separately from the outer boundary. The image has no scale bar and the source gives no stain information.
Photo: Human cheek cells from science class · KyrebSource describes a microscope photograph of the photographer’s own inner-cheek sample.Show labelled key: Answer key for animal-cell-micrograph
Human cheek-cell micrograph
Photo key
The purple-stained structure is the nucleus; the pale interior is cytoplasm. The cell boundary is visible, but the membrane is not separately resolved as a bilayer.
This is a real microscope photograph of a human cheek-cell sample, not a model. The cell surface membrane cannot be distinguished separately from the outer boundary. The image has no scale bar and the source gives no stain information.
Photo: Human cheek cells from science class · KyrebSource describes a microscope photograph of the photographer’s own inner-cheek sample.Practice question
What overall shape do the visible bacteria have? What does the scale annotation help you estimate?
Photograph / micrograph recognition only. The organism is identified by the source as cultured E. coli. This SEM does not reveal internal structures. Use the bacterial-cell schematic for cell contents; do not label DNA or plasmids on this photograph.
Photo: E. coli Bacteria (7316101966) · NIAIDScanning electron micrograph; the original image includes a 2.00 µm scale annotation.Show labelled key: Answer key for bacterial-cell-micrograph
E. coli scanning electron micrograph
Photo key
The image shows rod-shaped Escherichia coli. The printed scale annotation represents 2.00 µm. This scanning electron micrograph shows the outer form only; it does not show cytoplasm, DNA, a nucleoid, or plasmids.
The organism is identified by the source as cultured E. coli. This SEM does not reveal internal structures. Use the bacterial-cell schematic for cell contents; do not label DNA or plasmids on this photograph.
Photo: E. coli Bacteria (7316101966) · NIAIDScanning electron micrograph; the original image includes a 2.00 µm scale annotation.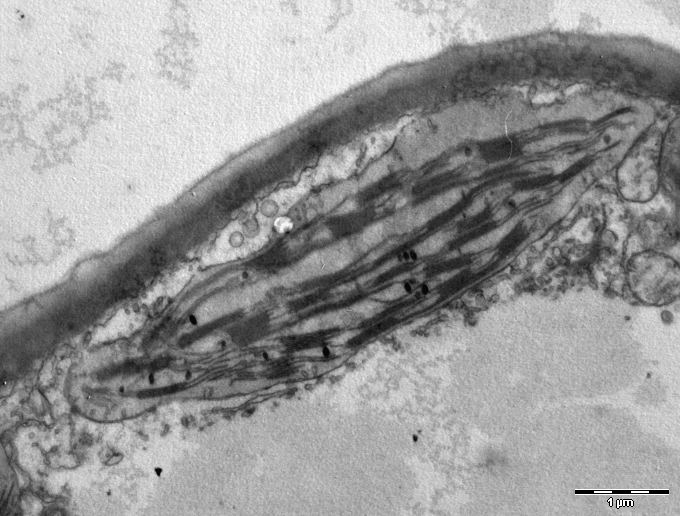
Practice question
In this TEM detail, identify the organelle outline and the repeated internal membrane stacks. What scale is shown?
Photograph / micrograph recognition only. The source names Anemone only as sp.; no exact species is identified. This image does not show a whole cell, cell wall, nucleus, or broad cytoplasm. Individual membrane bilayers are not resolved.
Photo: Chloroplast in leaf of Anemone sp TEM 12000x · And3k and Caper437TEM source page gives 12,000× magnification and a 1 µm scale bar.Show labelled key: Answer key for plant-chloroplast-tem
Chloroplast TEM
Photo key
This is a chloroplast from an Anemone sp. leaf cell. The organelle outline and internal membrane stacks are visible; the scale bar is 1 µm. The image shows an organelle detail, not a whole cell.
The source names Anemone only as sp.; no exact species is identified. This image does not show a whole cell, cell wall, nucleus, or broad cytoplasm. Individual membrane bilayers are not resolved.
Photo: Chloroplast in leaf of Anemone sp TEM 12000x · And3k and Caper437TEM source page gives 12,000× magnification and a 1 µm scale bar.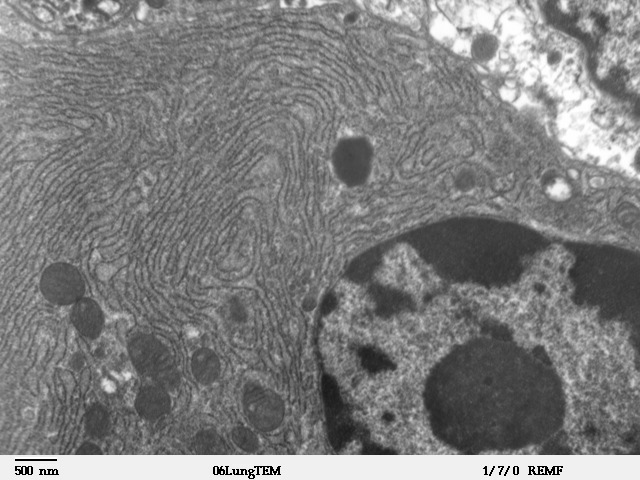
Practice question
Use relative position and appearance in this thin section to identify the visible part of the nucleus, rough endoplasmic reticulum, and mitochondria.
Photograph / micrograph recognition only. The source does not identify the mammal or establish donor health status. Only part of the cell is shown; the complete cell outline and surface membrane are not present.
Photo: Clara cell lung - TEM · Louisa Howard; Dartmouth Electron Microscope FacilityMammalian lung TEM collection.Source provenance: Dartmouth Electron Microscope FacilityShow labelled key: Answer key for animal-cell-tem
Mammalian bronchiolar club-cell TEM
Photo key
The source identifies part of the nucleus, rough endoplasmic reticulum, and mitochondria in the cytoplasm of a mammalian bronchiolar club (Clara) cell. A 500 nm scale bar is visible; the full cell boundary is outside this frame.
The source does not identify the mammal or establish donor health status. Only part of the cell is shown; the complete cell outline and surface membrane are not present.
Photo: Clara cell lung - TEM · Louisa Howard; Dartmouth Electron Microscope FacilityMammalian lung TEM collection.Source provenance: Dartmouth Electron Microscope Facility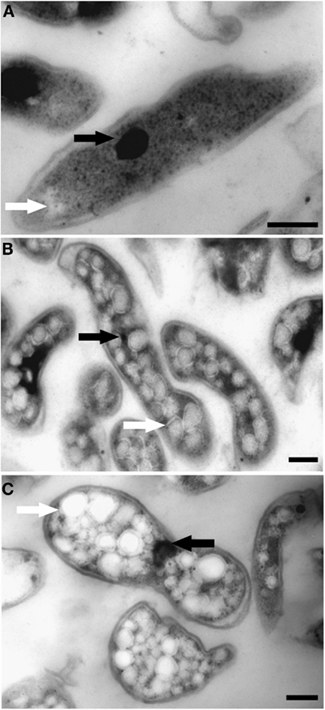
Practice question
Compare the cell outlines and internal contrast across panels A-C. What can be said about the arrow-marked regions without assigning them an organelle identity?
Photograph / micrograph recognition only. This is a different bacterium from E. coli. Do not use its arrows to claim that DNA, plasmids, or ribosomes are resolved. The source panels show cells under differing growth conditions.
Photo: Fmicb-03-00345-g005 · Ahmad F. Khadem, Muriel C. F. van Teeseling, Laura van Niftrik, Mike S. M. Jetten, Huub J. M. Op den Camp, and Arjan PolThree TEM panels with 200 nm scale bars.Show labelled key: Answer key for bacterial-cell-tem
Methylacidiphilum fumariolicum TEM panels
Photo key
These are chemically fixed, thin-sectioned Methylacidiphilum fumariolicum cells from different growth phases. Cell outlines and cytoplasm are visible; the arrows mark electron-light and electron-dense particles. The source does not identify these particles as DNA, plasmids, ribosomes, or other specific structures.
This is a different bacterium from E. coli. Do not use its arrows to claim that DNA, plasmids, or ribosomes are resolved. The source panels show cells under differing growth conditions.
Photo: Fmicb-03-00345-g005 · Ahmad F. Khadem, Muriel C. F. van Teeseling, Laura van Niftrik, Mike S. M. Jetten, Huub J. M. Op den Camp, and Arjan PolThree TEM panels with 200 nm scale bars.Microscope image-recognition and scale-bar practice: distinguish light-microscope views from TEMs and do not claim unresolved structures.
Topic group
Membranes and transport
- Core
Scope: Core · §2.1 Unit 1, 1.1 Movement across membranes
Open revision guidance
What to know
- Diffusion is net movement of particles from higher to lower concentration. Oxygen diffuses from alveolar air into blood and carbon dioxide from blood into alveoli; both cross cell-surface membranes down concentration gradients. Cell membranes are selectively permeable: some substances cross while others are restricted.
- Osmosis is net water movement across a partially permeable membrane from a dilute solution (higher water concentration) to a more concentrated solution. A Visking-tubing model represents selective passage by pore size but is not a living cell membrane.
What to do in an assessment
- For oxygen/carbon dioxide or another solute, state the concentration gradient, direction of net movement and membrane crossed.
- When interpreting Visking-tube results, state which substance crossed and relate it to pore size; do not infer that tubing performs active transport.
In plain language
For oxygen/carbon dioxide or another solute, state the concentration gradient, direction of net movement and membrane crossed.; When interpreting Visking-tube results, state which substance crossed and relate it to pore size; do not infer that tubing performs active transport.
Self-check
What does osmosis move across a partially permeable membrane?
Show the answer
Water moves net from a more dilute solution (higher water concentration) to a more concentrated solution.
Topic group
Enzymes and rate
- Core
Scope: Core · §2.1 Unit 1, 1.3 Digestion and digestive system; practical investigation skills
Open revision guidance
What to know
- Enzymes are protein catalysts. Each has an active site with a complementary shape to its substrate (the simple lock-and-key model); substrate binds and products leave without the enzyme being used up.
- Higher-tier only: enzymes can have different amino-acid sequences folded into different specific shapes; molecular collisions can form an enzyme–substrate complex.
- As temperature rises, enzyme reaction rate generally rises to an optimum; above the optimum, bonds maintaining enzyme shape are disrupted and the active site changes, so rate falls. pH away from an enzyme’s optimum can also reduce activity; boiling can denature most enzymes.
What to do in an assessment
- In a rate investigation change one factor (such as temperature or pH), keep enzyme/substrate amounts and reaction time controlled, and measure product formation or substrate disappearance consistently.
- Plot rate against the tested factor, identify the optimum, describe the rising rate to the optimum and explain the falling region by changed active-site shape; repeat measurements and report units.
In plain language
In a rate investigation change one factor (such as temperature or pH), keep enzyme/substrate amounts and reaction time controlled, and measure product formation or substrate disappearance consistently.; Plot rate against the tested factor, identify the optimum, describe the rising rate to the optimum and explain the falling region by changed active-site shape; repeat measurements and report units.
Self-check
What happens to many enzymes when heated well above their optimum temperature?
Show the answer
Heat changes the protein’s shape, including the active site, so substrate no longer fits as well and enzyme activity falls.
Topic group
Digestion and absorption
- Core
Scope: Core · §2.1 Unit 1, 1.3 Digestion and digestive system
Open revision guidance
What to know
- Digestion breaks large, insoluble food molecules into smaller soluble molecules that can be absorbed. Carbohydrases break starch/carbohydrates into sugars, proteases break proteins into amino acids, and lipases break fats into fatty acids and glycerol.
- The mouth begins mechanical breakdown; peristalsis moves food through oesophagus and gut. Stomach acid and protease digest protein; pancreas supplies digestive enzymes; small intestine completes digestion and absorbs soluble products; large intestine absorbs water.
- The liver makes bile and the gall bladder stores it; bile neutralises acidic chyme and emulsifies fat into small droplets, increasing area for lipase. Villi give a large area, a thin epithelium and blood supply for absorption.
- A Visking-tubing model can show that small soluble digestion products cross a partially permeable membrane whereas large food molecules do not.
- Digestive-system diagram labels include mouth, oesophagus, stomach, liver, gall bladder, bile duct, pancreas, small intestine, large intestine and anus. Bile enters the small intestine through the bile duct; pancreatic juice enters the small intestine.
What to do in an assessment
- Label the digestive route and accessory organs; follow food, bile and pancreatic juice to their sites of action.
- For each enzyme name substrate and products; distinguish digestion from absorption and explain how a villus supports rapid transfer.
In plain language
Label the digestive route and accessory organs; follow food, bile and pancreatic juice to their sites of action.; For each enzyme name substrate and products; distinguish digestion from absorption and explain how a villus supports rapid transfer.
Self-check
Where is bile made and stored, and how does it assist fat digestion?
Show the answer
The liver makes bile and the gall bladder stores it; bile neutralises acidic stomach contents and emulsifies fat into droplets for lipase.
View diagrams
Human digestive systemSimplified schematic; not to scale. - A
- B
- C
- D
- E
- F
- G
- H
- I
- J
- K
- L
- M
Show labelled key: Answer key for digestive-system
Human digestive systemSimplified schematic; not to scale. - AMouth
- BOesophagus
- CLiver
- DGall bladder
- EStomach
- FPancreas
- GDuodenum
- HIleum
- IColon
- JRectum
- KAnus
- LSalivary glands
- MBile duct
Digestive system: Blausen medical illustration
Practice question
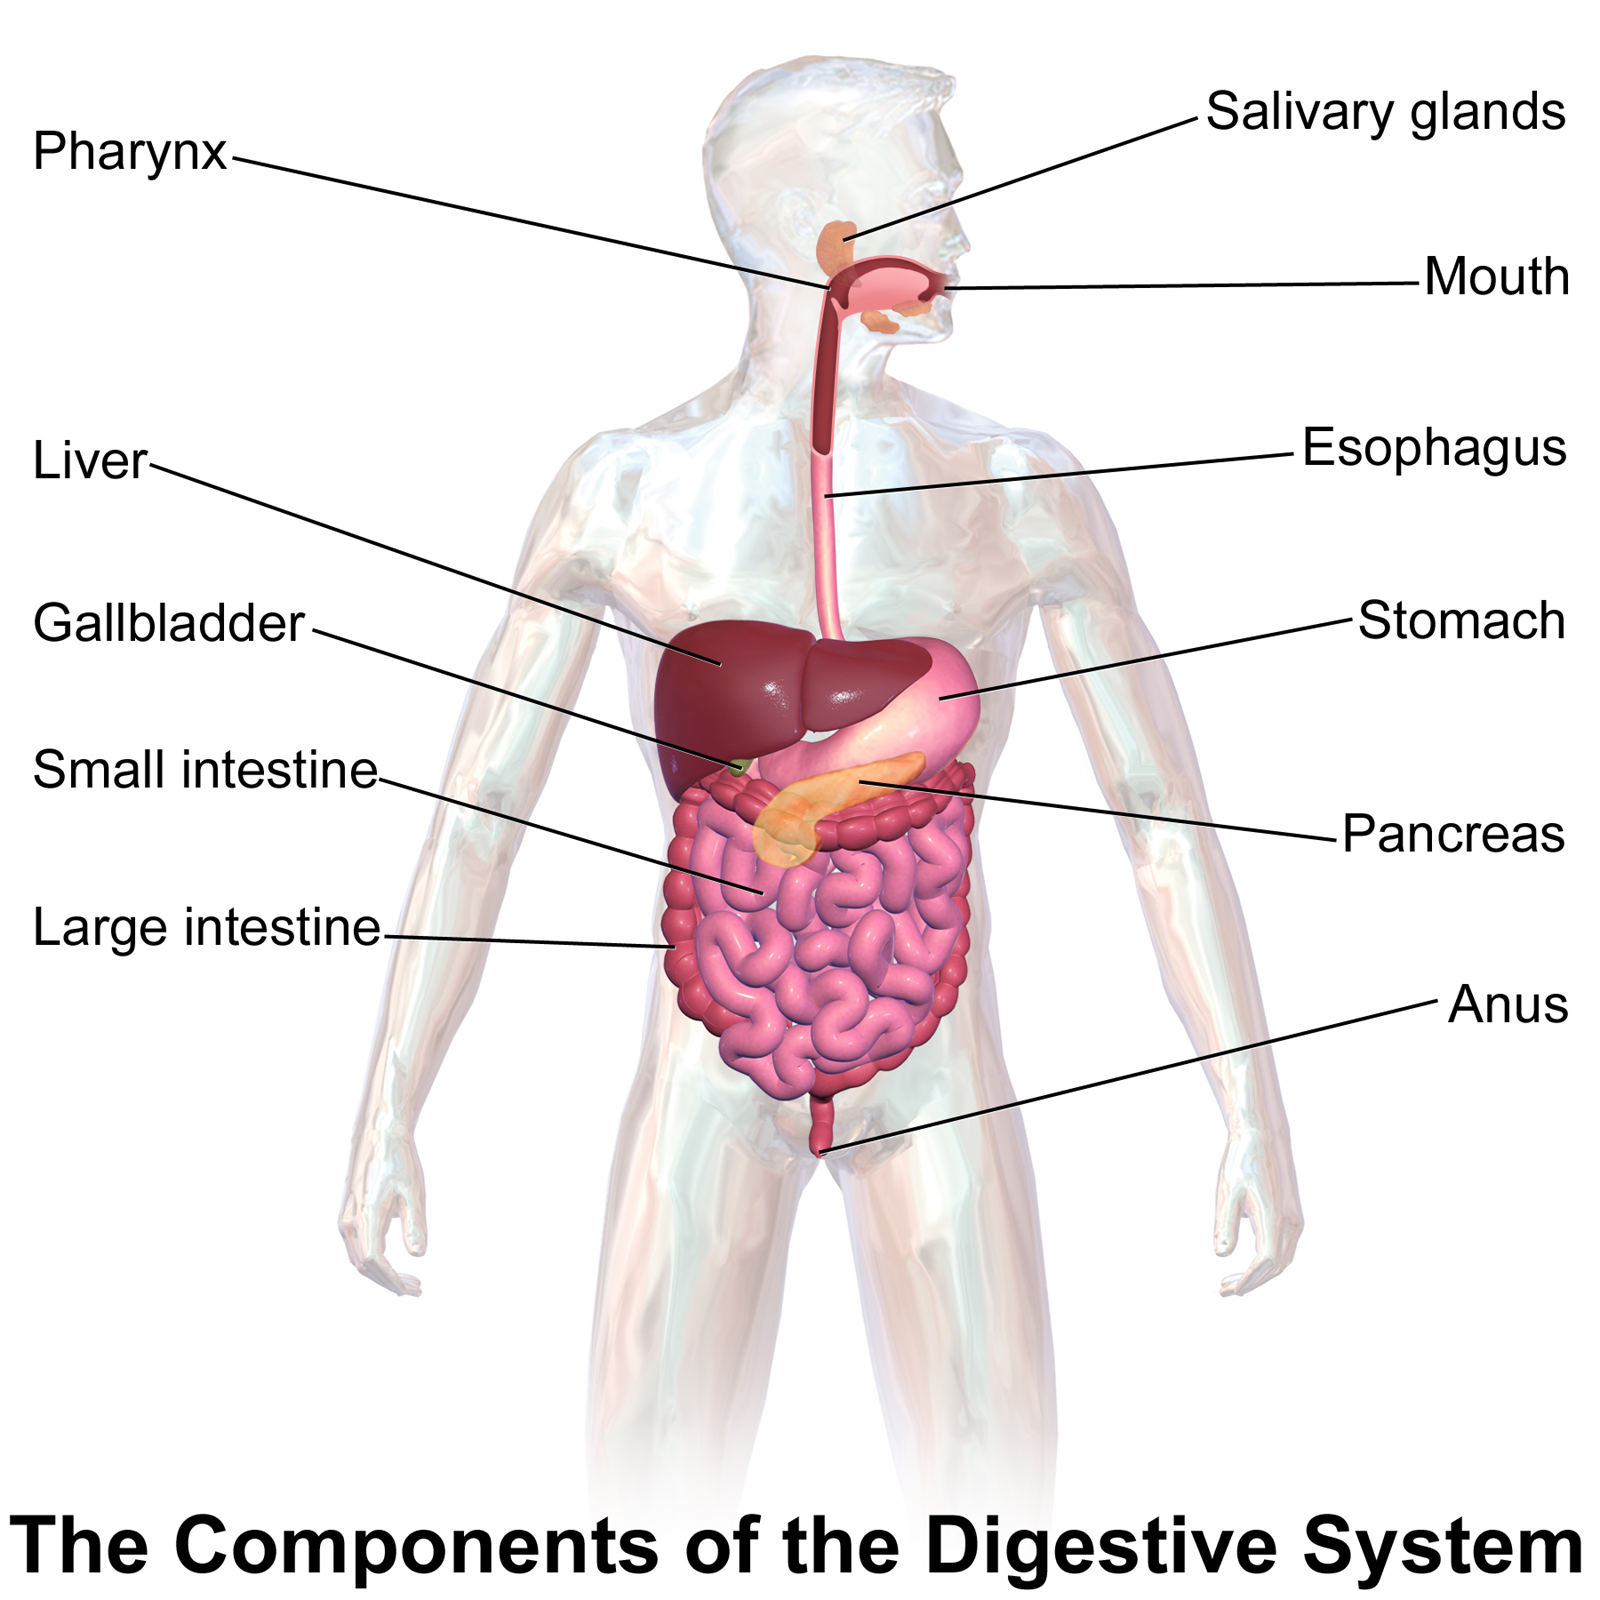
Use the printed organ labels in this medical illustration to describe the route food follows from the mouth through the pharynx and oesophagus, stomach, small intestine and large intestine to the anus. Which organ makes bile and which stores it? This broad view does not individually label the duodenum, ileum, colon or rectum; compare it with the full digestive-system schematic for practice with those detailed labels.
Medical-illustration recognition only. Blausen medical illustration, not a photograph, patient image or clinical image. The printed labels are part of the source artwork and remain visible; this is not an unlabelled recall exercise. Duodenum, ileum, colon and rectum are not individually labelled in this illustration.
Illustration: Blausen 0316: Digestive System · BruceBlaus and Blausen.com staff (2014)3D medical illustration; original artwork includes printed organ labels.Show labelled key: Answer key for digestive-system-illustration
Digestive system: Blausen medical illustration
Illustration key
The labelled route is mouth → pharynx → oesophagus → stomach → small intestine → large intestine → anus (the rectum lies before the anus but is not individually labelled here). The liver makes bile; the gallbladder stores and concentrates it. Use the full digestive-system schematic to identify the duodenum and ileum within the small intestine and the colon and rectum within the large intestine.
Blausen medical illustration, not a photograph, patient image or clinical image. The printed labels are part of the source artwork and remain visible; this is not an unlabelled recall exercise. Duodenum, ileum, colon and rectum are not individually labelled in this illustration.
Illustration: Blausen 0316: Digestive System · BruceBlaus and Blausen.com staff (2014)3D medical illustration; original artwork includes printed organ labels.Use the digestive-system practice/key figures to identify the digestive route and accessory organs, including the labelled bile duct, and compare visible evidence with organ functions.
Topic group
Gas exchange and breathing
- Core
Scope: Core · §2.1 Unit 1, 1.2 Respiratory system in humans
Open revision guidance
What to know
- Air reaches the alveoli through the nasal cavity, trachea, bronchi and bronchioles; alveoli occur at the ends of bronchioles. Label an alveolus, surrounding capillary, red blood cells and plasma when these are shown.
- An alveolus has a moist lining, a very thin wall (one cell thick), large surface area and dense capillary network. Ventilation and blood flow maintain steep concentration gradients: oxygen diffuses through alveolar and capillary walls into blood/plasma and red blood cells; carbon dioxide diffuses from blood to alveolar air.
- Oxygen diffuses through the alveolar/capillary walls into plasma and red blood cells, where it binds to haemoglobin; carbon dioxide diffuses from blood into alveolar air and is carried mainly in plasma before exhalation.
- Inspired air is about 21% oxygen and 0.04% carbon dioxide; expired air about 16% oxygen and 4% carbon dioxide, because body cells use oxygen in respiration and produce carbon dioxide; nitrogen changes little. Limewater turns milky/cloudy when carbon dioxide is present.
- Mucus traps particles and cilia move mucus toward the throat to be swallowed. Smoking damages cilia and increases mucus, so particles/pathogens are cleared less effectively; smoking also raises risk of lung disease/cancer and emphysema reduces alveolar surface area.
- During inhalation the diaphragm contracts/flattens and external intercostal muscles lift ribs; thoracic volume increases and pressure falls so air enters. Exhalation reverses these changes. A bell-jar model illustrates pressure/volume change but not ribs, real lungs or gas exchange.
What to do in an assessment
- On respiratory/alveolus diagrams trace air to an alveolus and label the end bronchiole, alveolar wall/moist lining, capillary wall, red blood cells and plasma; the attached detailed alveolus schematic supports these labels.
- Explain oxygen and carbon-dioxide diffusion by gradient, direction and adaptation; compare inspired/expired values and state why they differ.
- State the positive limewater result (milky/cloudy) for carbon dioxide and explain how smoking-related cilia damage affects mucus clearance.
In plain language
On respiratory/alveolus diagrams trace air to an alveolus and label the end bronchiole, alveolar wall/moist lining, capillary wall, red blood cells and plasma; the attached detailed alveolus schematic supports these labels.; Explain oxygen and carbon-dioxide diffusion by gradient, direction and adaptation; compare inspired/expired values and state why they differ.; State the positive limewater result (milky/cloudy) for carbon dioxide and explain how smoking-related cilia damage affects mucus clearance.
Self-check
Why does emphysema reduce oxygen uptake into blood?
Show the answer
Damage to alveolar walls reduces surface area for diffusion, so oxygen enters capillary blood more slowly.
View diagrams
Human breathing systemSimplified schematic; not to scale. - A
- B
- C
- D
- E
- F
- G
- H
- I
- J
- K
Show labelled key: Answer key for breathing-system
Human breathing systemSimplified schematic; not to scale. - ALarynx
- BTrachea
- CBronchi
- DBronchioles
- EAlveoli
- FCapillaries
- GLung
- HRibs
- IIntercostal muscles
- JDiaphragm
- KNasal cavity
Intercostal muscles between two ribsSimplified schematic; not to scale. - A
- B
- C
- D
- E
- F
Show labelled key: Answer key for intercostal-muscles
Intercostal muscles between two ribsSimplified schematic; not to scale. - ARib above
- BRib below
- CExternal intercostal: fibres down and forwards
- DInternal intercostal: fibres down and backwards
- ESternum (front)
- FVertebra (back)
Alveolus and surrounding capillarySchematic, not to scale or a photograph. O₂ diffuses from alveolar air into blood; CO₂ diffuses from blood into the alveolus. Show labelled key: Answer key for alveolus-capillary
Alveolus and surrounding capillarySchematic, not to scale or a photograph. O₂ diffuses from alveolar air into blood; CO₂ diffuses from blood into the alveolus. - ATerminal bronchiole
- BAlveolar wall
- CMoist lining
- DCapillary wall
- ERed blood cell
- FPlasma
The respiratory-system key labels the nasal cavity and airways; the intercostal model supports ventilation. The alveolus–capillary schematic labels terminal bronchiole, alveolar wall, moist lining, capillary wall, red blood cell and plasma; final geometry and label-arrow review passed.
Topic group
Blood and circulation
- Core
Scope: Core · §2.1 Unit 1, 1.4 Circulatory system in humans
Open revision guidance
What to know
- The heart is divided into right and left sides by a septum. Atria receive blood, ventricles pump it; valves prevent backflow. The left ventricular wall is thicker because it pumps around the body.
- Arteries carry blood away from the heart under higher pressure and have thick muscular, elastic walls with a relatively narrow lumen; veins return blood at lower pressure, have thinner walls and a wider lumen and may contain valves; capillaries have a one-cell-thick wall and narrow lumen for exchange. Capillaries form networks so substances diffuse over short distances between blood and body cells; every cell is close to a capillary.
- Blood flows heart → lungs → heart → body → heart. Pulmonary arteries carry blood to lungs; pulmonary veins return it, exceptions to usual oxygenation patterns. At capillaries, substances diffuse between blood and tissues.
- Coronary arteries supply heart muscle; narrowing/blockage can reduce oxygen supply and cause coronary heart disease, heart attack or related cardiovascular disease. Risk factors include smoking, poor diet/high saturated fat, inactivity and other factors; describe effects and compare prevention/treatments from evidence.
What to do in an assessment
- Trace a named double-circulation route through each heart chamber, vessel and organ in order; mark where blood becomes oxygenated.
- Compare artery, vein and capillary structure against pressure, direction and exchange role.
In plain language
Trace a named double-circulation route through each heart chamber, vessel and organ in order; mark where blood becomes oxygenated.; Compare artery, vein and capillary structure against pressure, direction and exchange role.
Self-check
Why is blood in the pulmonary artery low in oxygen although most arteries carry oxygen-rich blood?
Show the answer
The pulmonary artery carries blood from the right ventricle to the lungs before oxygen uptake, so it is a named exception.
View diagrams
Section through the human heartSimplified schematic; not to scale. - A
- B
- C
- D
- E
- F
- G
- H
- I
- J
- K
- L
- M
- N
Show labelled key: Answer key for heart-section
Section through the human heartSimplified schematic; not to scale. - ARight atrium
- BRight ventricle
- CLeft atrium
- DLeft ventricle
- ESeptum
- FMuscular wall
- GTricuspid valve
- HBicuspid (mitral) valve
- ISemilunar valves
- JCoronary arteries
- KVena cava
- LPulmonary artery
- MPulmonary vein
- NAorta
Double circulation and major vesselsColour indicates oxygenation, not artery or vein type. Simplified schematic; not to scale. - A
- B
- C
- D
- E
- F
- G
- H
- I
- J
- K
- L
- M
- N
Show labelled key: Answer key for circulation-vessels
Double circulation and major vesselsColour indicates oxygenation, not artery or vein type. Simplified schematic; not to scale. - AHeart
- BLungs
- CPulmonary artery: heart → lungs
- DPulmonary vein: lungs → heart
- EAorta: away from heart
- FVena cava: to heart
- GGut
- HHepatic portal vein: gut → liver
- ILiver
- JHepatic artery: to liver
- KHepatic veins: from liver
- LKidney
- MRenal artery: to kidney
- NRenal vein: from kidney
Heart and circulation keys include the tricuspid and bicuspid valves, semilunar valves, aorta and vena cava; use the vessel route to compare structure and circulation.
Topic group
Transport in plants
- Core
Scope: Core · §2.1 Unit 1, 1.5 Plants and photosynthesis; specified transpiration practical
Open revision guidance
What to know
- Xylem vessels are dead, hollow, lignified tubes carrying water and mineral ions from roots toward leaves; transpiration is water loss from leaves and the transpiration stream follows evaporation from mesophyll.
- Phloem transports dissolved sugars such as sucrose from photosynthetic sources to sinks by translocation; different sieve tubes can carry material in opposite directions.
- Sucrose made in leaves is carried in phloem to sinks; cells can use it in respiration or convert it to starch for storage. Xylem carries water/mineral ions upward and phloem translocates dissolved sugars; these are distinct processes.
- Root hairs increase absorbing area; water enters roots by osmosis. Stomata and guard cells regulate gas exchange and water loss.
- Light intensity, temperature, humidity and air movement can change transpiration rate; evaluate plant/cutting or potometer data against the factor changed and controls.
What to do in an assessment
- Distinguish transpiration (water loss/stream through xylem) from translocation (sugar movement through phloem).
- Describe a potometer/cutting investigation by naming the measured movement, environmental factor and controls; movement of an air bubble estimates water uptake, not transpiration directly.
- Explain the source-to-sink route for sucrose and how leaf evaporation contributes to upward xylem movement.
In plain language
Distinguish transpiration (water loss/stream through xylem) from translocation (sugar movement through phloem).; Describe a potometer/cutting investigation by naming the measured movement, environmental factor and controls; movement of an air bubble estimates water uptake, not transpiration directly.; Explain the source-to-sink route for sucrose and how leaf evaporation contributes to upward xylem movement.
Self-check
Which tissue moves sucrose from a photosynthesising leaf to a growing root?
Show the answer
Phloem, by translocation from the source leaf to the sink root.
View diagrams
Dicot leaf section · Unlabelled practice · Schematic, simplified and not to scale. Show labelled key: Answer key for leaf-section
Dicot leaf section · Structure key · Schematic, simplified and not to scale. Non-woody dicot root section · Unlabelled practice · Schematic, simplified and not to scale. Show labelled key: Answer key for dicot-root-section
Non-woody dicot root section · Structure key · Schematic, simplified and not to scale. Non-woody dicot stem section · Unlabelled practice · Schematic, simplified and not to scale. Show labelled key: Answer key for dicot-stem-section
Non-woody dicot stem section · Structure key · Schematic, simplified and not to scale. Root-hair cell · Unlabelled practice · Schematic, simplified and not to scale. Show labelled key: Answer key for root-hair-cell
Root-hair cell · Structure key · Schematic, simplified and not to scale. 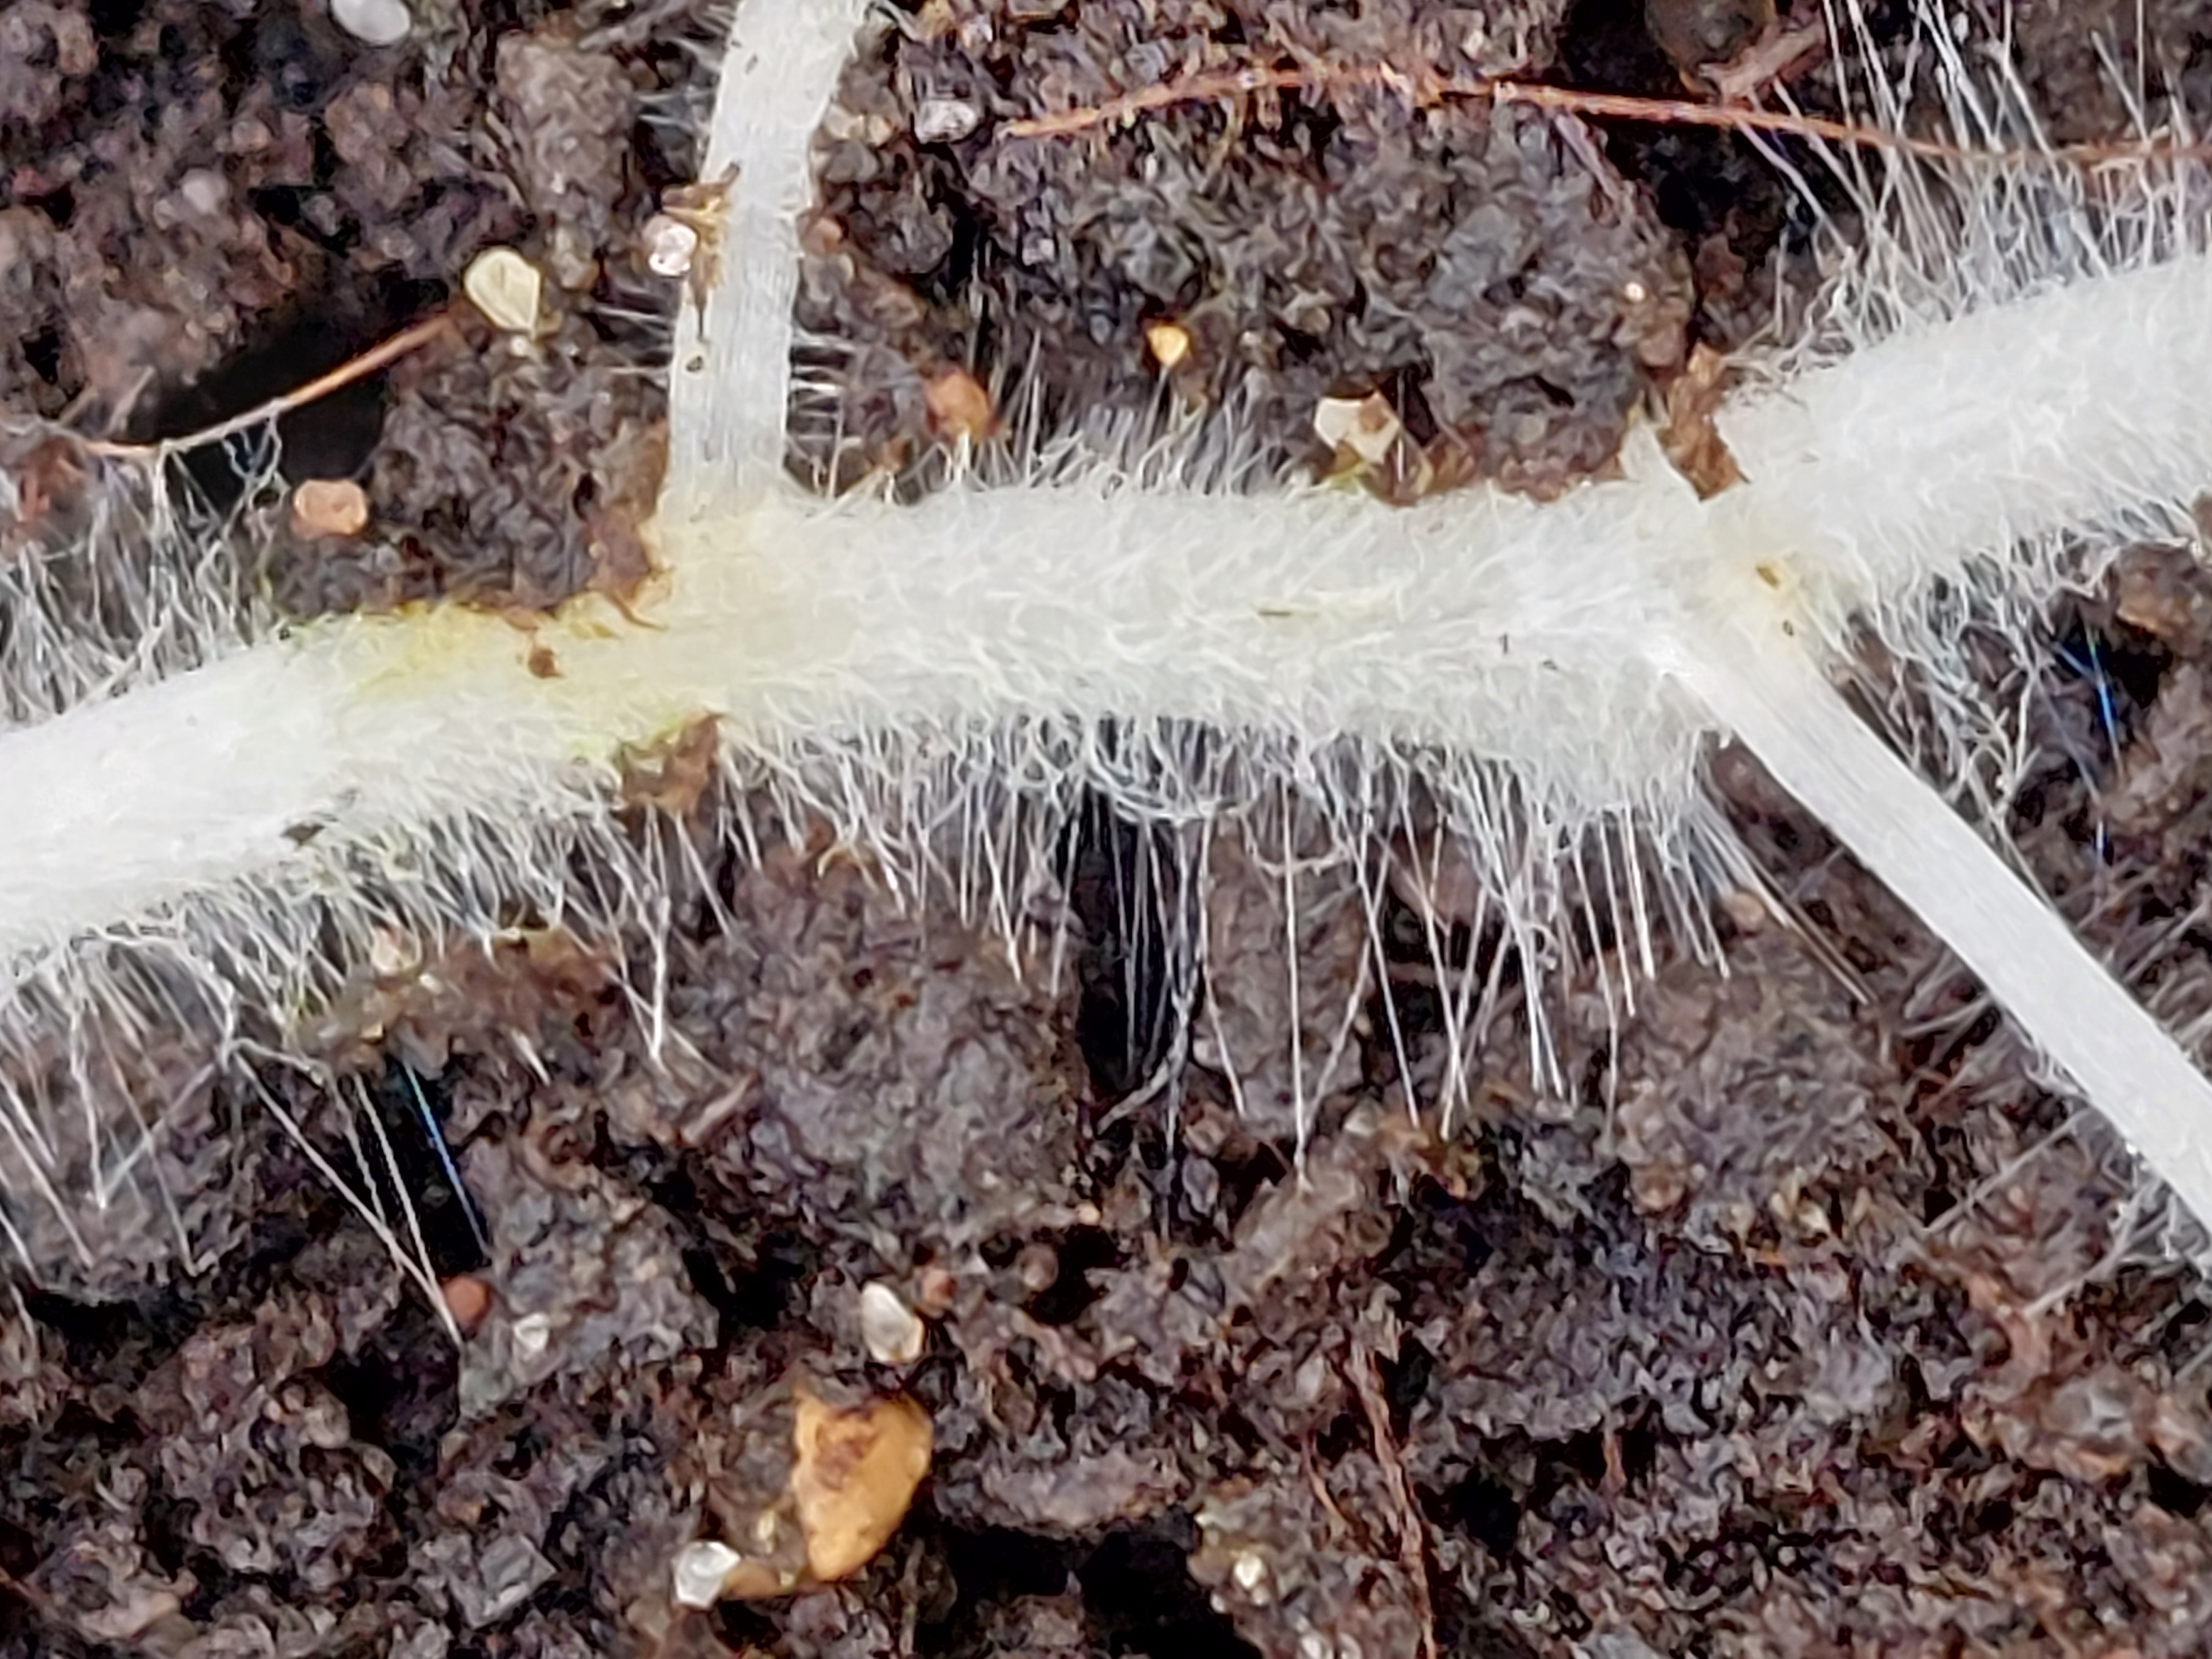
Practice question
What fine projections extend from the root surface into the surrounding soil? How might many such projections affect contact with soil water and dissolved mineral ions?
Photograph / micrograph recognition only. This macro photograph shows numerous root hairs against soil, not the internal structure or boundary of one individual root-hair cell. No scale is provided.
Photo: Cucurbita maxima root hairs · Josef SchlagheckenClose-up photograph; no scale provided.Show labelled key: Answer key for root-hair-photo
Cucurbita maxima root hairs
Photo key
The fine projections are root hairs. They are extensions of root epidermal cells; their large combined surface area increases contact with soil water and dissolved mineral ions.
This macro photograph shows numerous root hairs against soil, not the internal structure or boundary of one individual root-hair cell. No scale is provided.
Photo: Cucurbita maxima root hairs · Josef SchlagheckenClose-up photograph; no scale provided.Label plant transport tissues and root-hair structure; distinguish schematic tissue drawings from the root-hair photograph.
Topic group
Photosynthesis and limiting factors
- Core
Scope: Core · §2.1 Unit 1, 1.5 Photosynthesis
Open revision guidance
What to know
- Photosynthesis transfers light energy into chemical energy: carbon dioxide + water → glucose + oxygen; chlorophyll in chloroplasts absorbs light. Light intensity, carbon-dioxide concentration and temperature affect rate.
- Higher-tier extension: explain these as limiting factors; as one factor rises the rate increases until another factor limits it. Higher-tier Unit 1 mathematical skill: inverse proportion/inverse-square law relates light intensity and distance in this photosynthesis context.
- Glucose can be used in respiration or converted to starch for storage; it can contribute to cellulose, oils and plant proteins when suitable mineral ions are available.
- Photosynthesis rate can be investigated by counting oxygen bubbles or measuring oxygen/carbon dioxide with sensors/data loggers. Sodium hydroxide absorbs carbon dioxide; a leaf starch test indicates stored product after destarching and exposure.
What to do in an assessment
- Balance a description around inputs, products, light and chlorophyll; for Higher tier interpret the limiting factor before and after a plateau and apply the inverse-square relationship to light intensity and distance.
- Plan a fair investigation: change one factor, control others, collect repeats over a useful range, and use a sensor/counting method consistently.
- For a starch test decolourise the leaf safely in hot ethanol using a water bath, rinse, add iodine and record the colour; state the inference.
In plain language
Balance a description around inputs, products, light and chlorophyll; for Higher tier interpret the limiting factor before and after a plateau and apply the inverse-square relationship to light intensity and distance.; Plan a fair investigation: change one factor, control others, collect repeats over a useful range, and use a sensor/counting method consistently.; For a starch test decolourise the leaf safely in hot ethanol using a water bath, rinse, add iodine and record the colour; state the inference.
Self-check
What are the reactants and products in photosynthesis?
Show the answer
Carbon dioxide and water are used to make glucose and oxygen; chlorophyll absorbs light energy.
View diagrams
Dicot leaf section · Unlabelled practice · Schematic, simplified and not to scale. Show labelled key: Answer key for leaf-section
Dicot leaf section · Structure key · Schematic, simplified and not to scale. Practice question
In this TEM detail, identify the organelle outline and the repeated internal membrane stacks. What scale is shown?
Photograph / micrograph recognition only. The source names Anemone only as sp.; no exact species is identified. This image does not show a whole cell, cell wall, nucleus, or broad cytoplasm. Individual membrane bilayers are not resolved.
Photo: Chloroplast in leaf of Anemone sp TEM 12000x · And3k and Caper437TEM source page gives 12,000× magnification and a 1 µm scale bar.Show labelled key: Answer key for plant-chloroplast-tem
Chloroplast TEM
Photo key
This is a chloroplast from an Anemone sp. leaf cell. The organelle outline and internal membrane stacks are visible; the scale bar is 1 µm. The image shows an organelle detail, not a whole cell.
The source names Anemone only as sp.; no exact species is identified. This image does not show a whole cell, cell wall, nucleus, or broad cytoplasm. Individual membrane bilayers are not resolved.
Photo: Chloroplast in leaf of Anemone sp TEM 12000x · And3k and Caper437TEM source page gives 12,000× magnification and a 1 µm scale bar.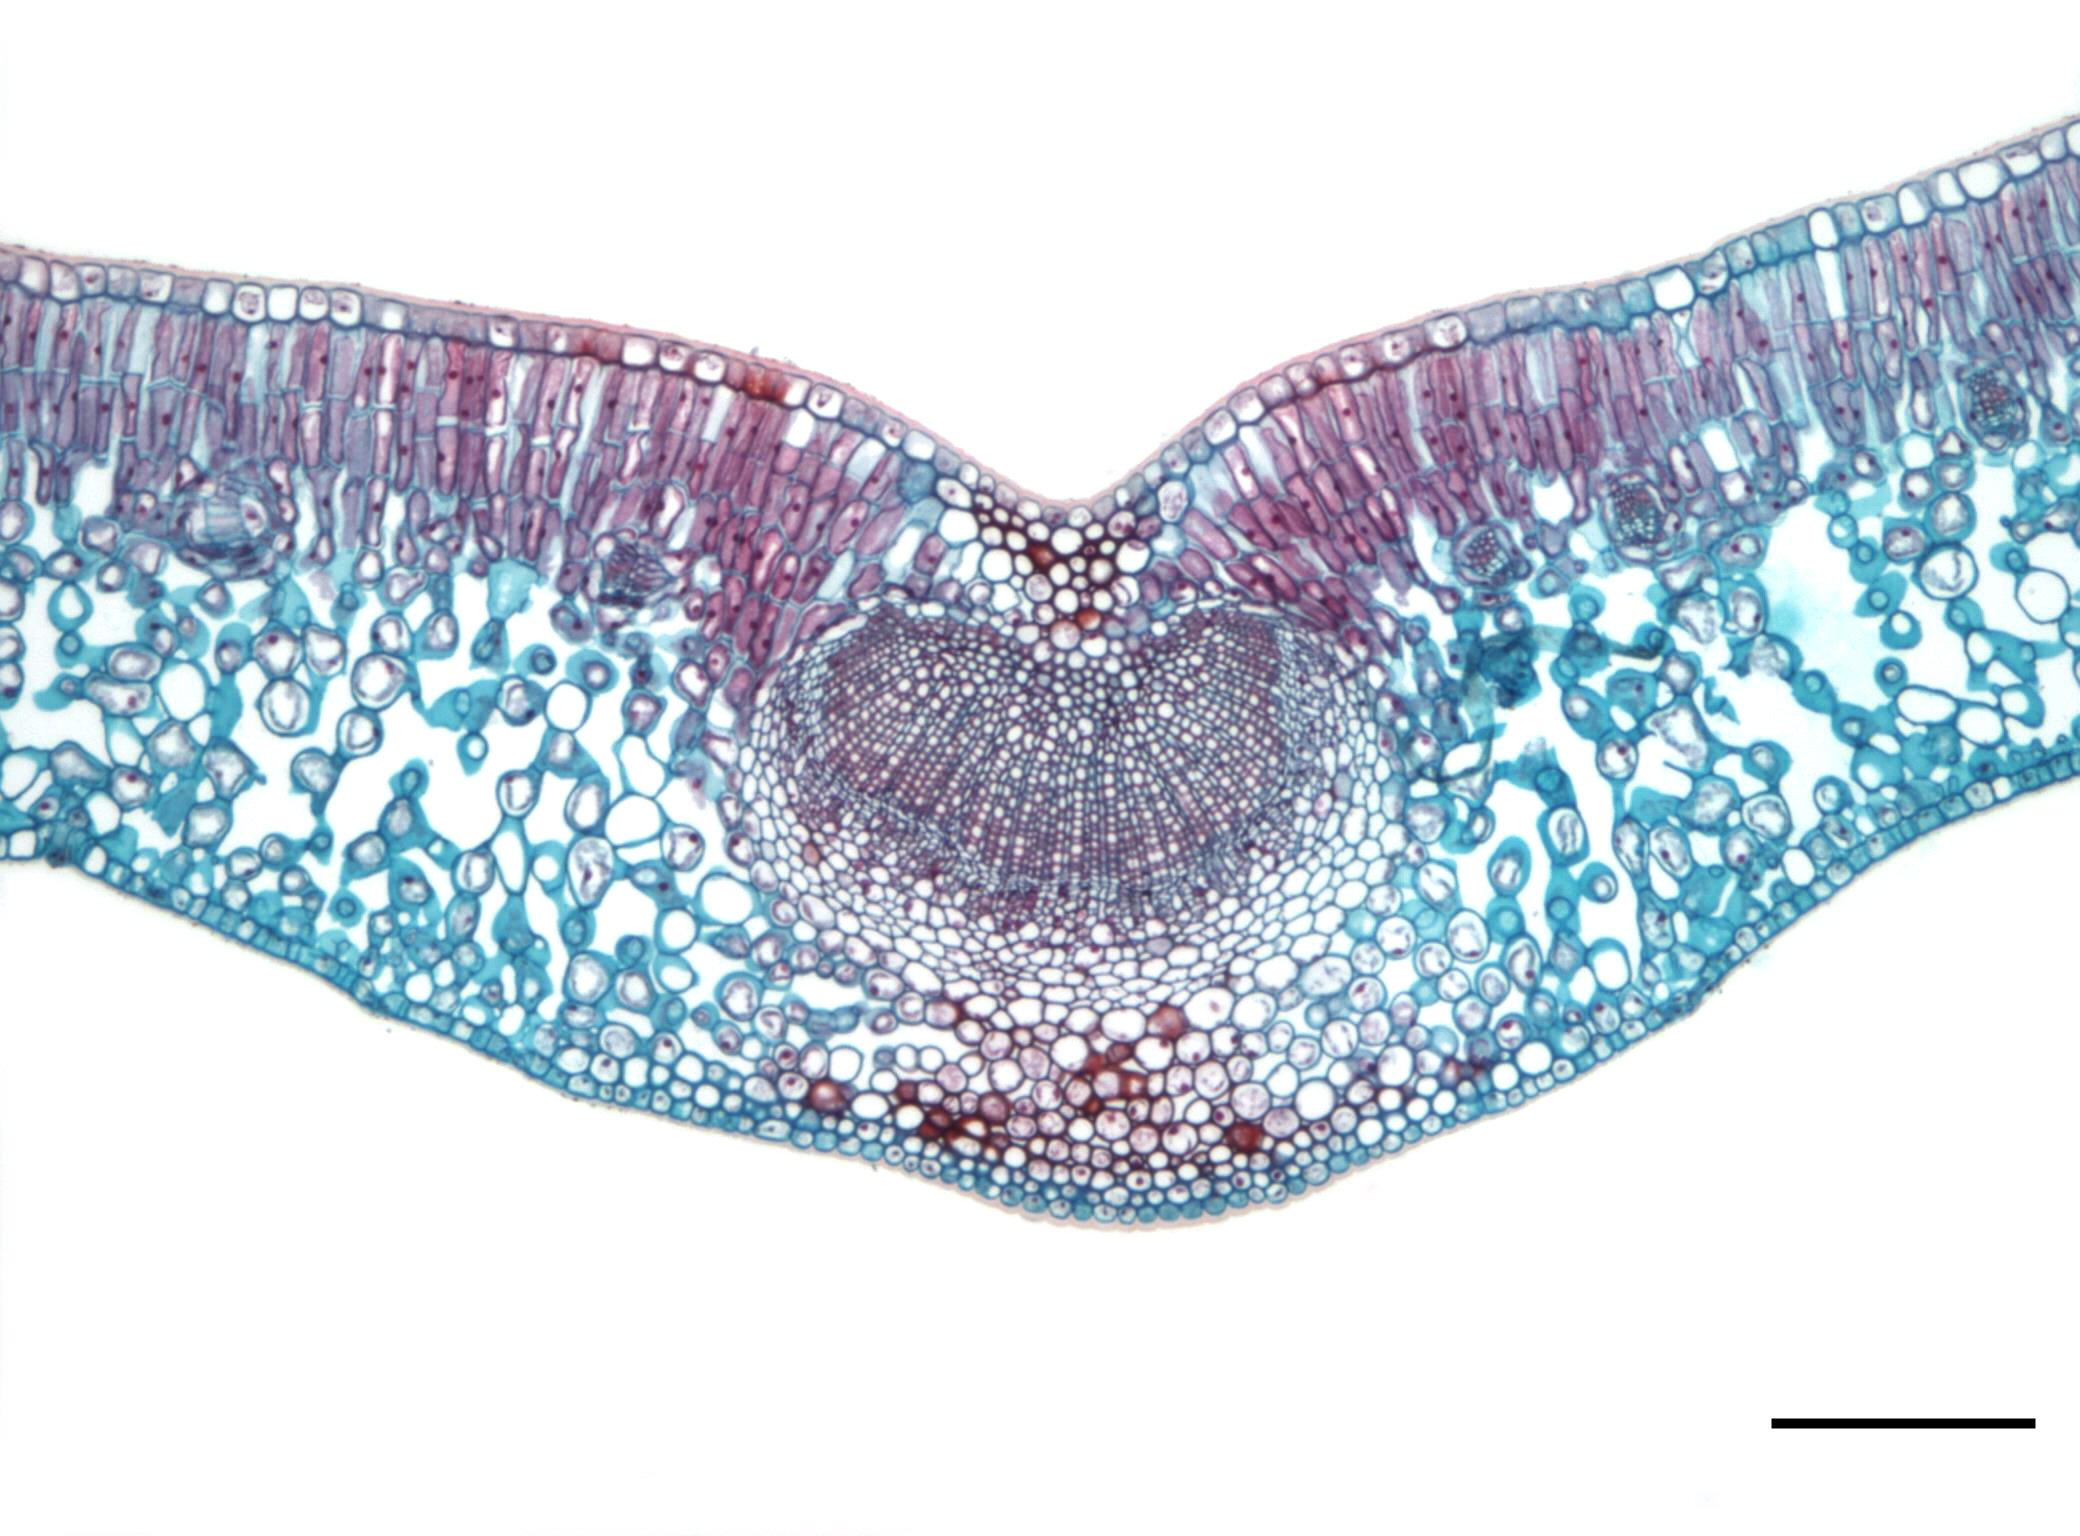
Practice question
Read the section from its more regular, column-like tissue toward the looser tissue with larger spaces. Which leaf regions can you recognise, and where is the vein?
Photograph / micrograph recognition only. Species is not identified. This is a dicot example, but not a species-specific specimen.
Photo: Dicot leaf · Jon Houseman; source credit also names Matthew FordPhotomicrograph with a 0.2 mm scale bar.Show labelled key: Answer key for leaf-micrograph
Dicot leaf cross-section
Photo key
The source identifies this as a dicot leaf in transverse section. Elongated palisade tissue lies beneath the upper surface; looser spongy tissue with air spaces is toward the lower surface; a central vein is visible. Individual xylem and phloem are not resolved clearly enough here to label.
Species is not identified. This is a dicot example, but not a species-specific specimen.
Photo: Dicot leaf · Jon Houseman; source credit also names Matthew FordPhotomicrograph with a 0.2 mm scale bar.Use leaf/chloroplast structure for photosynthesis context; visual does not replace measurement or interpretation in a rate investigation.
Topic group
Respiration and energy
- Core
Scope: Core · §2.1 Unit 1, 1.2 Respiration
Open revision guidance
What to know
- Aerobic respiration is the enzyme-controlled breakdown of glucose using oxygen, releasing energy and producing carbon dioxide and water. Word equation (common content): glucose + oxygen → carbon dioxide + water.
- Anaerobic respiration occurs without oxygen; human muscle cells break glucose down to lactic acid. Higher-tier only: the word equation and comparison showing incomplete breakdown releases less ATP per glucose appear in the Unit 1 Higher supplement. Oxygen debt is additional oxygen needed after exercise to restore resting conditions.
- Breathing/ventilation supplies oxygen and removes carbon dioxide; cellular respiration in cells transfers energy for muscle contraction and other processes.
What to do in an assessment
- Write the aerobic respiration word equation and distinguish breathing from cellular respiration.
- Explain the product of muscle anaerobic respiration; the anaerobic word equation and ATP-efficiency comparison are Higher-tier only and appear in the Unit 1 Higher supplement.
In plain language
Write the aerobic respiration word equation and distinguish breathing from cellular respiration.; Explain the product of muscle anaerobic respiration; the anaerobic word equation and ATP-efficiency comparison are Higher-tier only and appear in the Unit 1 Higher supplement.
Self-check
What are the reactants in the common aerobic respiration word equation?
Show the answer
Glucose and oxygen.
Topic group
Pathogens and transmission
- Core
Scope: Core · §2.2 Unit 2, 2.8 Disease, defence and treatment
Open revision guidance
What to know
- Most microorganisms are harmless or beneficial; some are pathogens. Pathogens include bacteria, viruses, protists and fungi. A bacterial cell has a cell wall, membrane, cytoplasm and genetic material, and may contain plasmids; viruses have genetic material within a protein coat and reproduce in host cells.
- Communicable pathogens spread by direct contact, droplets/aerosols, body fluids, water, insects/vectors or contaminated food. HIV attacks immune cells and can lead to AIDS; Chlamydia is a bacterial sexually transmitted infection that may be symptomless but damage reproductive health. Malaria is caused by a protist carried by mosquitoes; it enters and reproduces in red blood cells, causing recurrent fever and damaging/destroying infected cells. Prevent spread with measures matching the route, including safer sex, screening, hygiene and vector protection/control.
- Skin/mucus/cilia and infection-control measures limit entry or transmission. Hygiene, safe food/water, barrier methods, isolation and vector control should match the route of spread.
What to do in an assessment
- For HIV/AIDS, Chlamydia and malaria connect pathogen type, route, main effect on the sufferer and one prevention method; distinguish an infection from its symptoms.
- In an unfamiliar outbreak, identify evidence of transmission and choose a control measure that interrupts the actual route.
In plain language
For HIV/AIDS, Chlamydia and malaria connect pathogen type, route, main effect on the sufferer and one prevention method; distinguish an infection from its symptoms.; In an unfamiliar outbreak, identify evidence of transmission and choose a control measure that interrupts the actual route.
Self-check
Why is mosquito control relevant to malaria transmission?
Show the answer
Mosquitoes are vectors that transfer the malaria-causing protist between hosts; reducing vector contact can reduce transmission.
Topic group
Defences, immunity and medicines
- Core
Scope: Core · §2.2 Unit 2, 2.8 Disease, defence and treatment; specified antimicrobial context
Open revision guidance
What to know
- Defences include intact skin as a barrier, blood clotting to seal wounds, mucus/cilia, phagocytes that engulf pathogens and lymphocytes that produce specific antibodies and antitoxins. Antigens from pathogens are recognised as foreign; matching antibodies bind them and can neutralise/mark pathogens or toxins.
- Vaccines stimulate lymphocytes using pathogen-derived antigens. Bacterial vaccines may use bacterial cells or their purified antigens/toxoids; viral vaccines use viral particles or viral antigens prepared in a suitable weakened/inactivated or otherwise safe form. The antigens stimulate antibody production and memory cells; later exposure can cause a faster, larger response. Immunity is specific and does not guarantee that exposure cannot occur.
- Antibiotics such as penicillin, originally obtained from microorganisms, kill or inhibit susceptible bacteria, not viruses. Overuse selects resistant strains such as MRSA; infection-control measures (hand hygiene, cleaning, screening/isolation where appropriate) and responsible prescribing help limit spread.
- Vaccination choices can consider disease likelihood/severity, effectiveness, side effects, individual circumstances and effects on wider transmission; evaluate evidence rather than assert that one factor determines every decision.
What to do in an assessment
- Compare first exposure with re-exposure using antigen → specific antibody → memory cell → faster response; explain that vaccine antigens originate from the target pathogen.
- Distinguish phagocytosis from antibody action and match antimicrobial treatment to bacterial versus viral causation.
- Explain antibiotic resistance as selection of resistant bacteria, not bacteria choosing to adapt.
In plain language
Compare first exposure with re-exposure using antigen → specific antibody → memory cell → faster response; explain that vaccine antigens originate from the target pathogen.; Distinguish phagocytosis from antibody action and match antimicrobial treatment to bacterial versus viral causation.; Explain antibiotic resistance as selection of resistant bacteria, not bacteria choosing to adapt.
Self-check
Why do antibiotics not treat influenza?
Show the answer
Influenza is caused by a virus; antibiotics act on bacterial structures or processes and do not kill viruses.
Topic group
Nervous coordination
- Core
Scope: Core · §2.2 Unit 2, 2.5 Response and regulation
Open revision guidance
What to know
- Receptors detect light, sound, touch, temperature or chemicals; impulses travel along sensory neurones to the brain/spinal cord (CNS). Motor neurones carry impulses to effectors; the nervous system includes the CNS and nerves.
- Reflexes are rapid, automatic responses that may protect the body. The detailed reflex-arc sequence and labels are Higher-tier only and taught in the Unit 2 supplement.
- Reaction time can be measured by catching a falling ruler; distance fallen is converted to time using the supplied scale/relationship. Practice, attention, fatigue and distractions should be considered as influences.
- Examples of rapid automatic reflexes include withdrawal from a painful stimulus, blinking and pupil-size response to light.
What to do in an assessment
- Explain a common reflex as a rapid automatic response and identify a receptor/effector from a stated example; Higher-tier arc order and labels are confined to the Unit 2 supplement.
- For the ruler-drop investigation, use the same release method, record distance, repeat, calculate a mean and control practice/order effects.
In plain language
Explain a common reflex as a rapid automatic response and identify a receptor/effector from a stated example; Higher-tier arc order and labels are confined to the Unit 2 supplement.; For the ruler-drop investigation, use the same release method, record distance, repeat, calculate a mean and control practice/order effects.
Self-check
What is one common function of a receptor in the nervous system?
Show the answer
A receptor detects a stimulus, such as light, sound, touch, temperature or a chemical change.
Topic group
Hormones and homeostasis
- Core
Scope: Core · §2.2 Unit 2, 2.5 Response and regulation
Open revision guidance
What to know
- Hormones are chemical messengers carried in blood to target cells with matching receptors. Homeostasis maintains relatively constant internal conditions; the Higher-tier-only negative-feedback mechanism is taught in the Unit 2 supplement.
- Insulin is released when blood glucose is too high and promotes glucose uptake and storage as glycogen, lowering blood glucose. Diabetes mellitus is a condition in which blood-glucose concentration is abnormally high because the body does not produce sufficient insulin or respond to it effectively.
- Type 1 diabetes involves inadequate insulin production and may be treated with insulin; type 2 diabetes involves cells responding poorly to insulin and management can include diet/activity changes and medicines. Causes and treatment differ.
- Alcohol and other drugs can alter body chemistry; investigate lifestyle associations with type 2 diabetes without treating association as causation.
What to do in an assessment
- For a glucose-control example, identify high blood glucose and the common insulin response; Higher-tier glucagon and negative-feedback detail is in the Unit 2 supplement.
- Compare type 1 and type 2 diabetes using cause and treatment; interpret population/lifestyle data as association unless a causal design supports stronger claims.
In plain language
For a glucose-control example, identify high blood glucose and the common insulin response; Higher-tier glucagon and negative-feedback detail is in the Unit 2 supplement.; Compare type 1 and type 2 diabetes using cause and treatment; interpret population/lifestyle data as association unless a causal design supports stronger claims.
Self-check
What hormone helps lower high blood glucose?
Show the answer
Insulin promotes uptake of glucose by cells and storage as glycogen, lowering blood-glucose concentration.
Topic group
Kidneys and water balance
- Core
Scope: Core · §2.2 Unit 2, 2.6 Role of kidney in homeostasis
Open revision guidance
What to know
- Kidneys filter blood to remove urea and regulate the amount of water and salts; urea is made in the liver from excess amino acids. Urine is formed from substances removed from blood and passes kidney → ureter → bladder → urethra. Renal artery brings blood from the aorta; renal vein returns it to the vena cava. Kidney section labels include cortex, medulla, pelvis and ureter.
- Urine contains urea and excess salts/water. Blood or abnormal cells in urine can indicate kidney disease; glucose in urine can indicate diabetes. Water shortage leads to a smaller amount of more concentrated urine; excess water leads to a larger amount of dilute urine.
- Higher-tier only: nephron blood supply, filtration under pressure and selective reabsorption are taught in the Unit 2 supplement; ADH changes collecting-duct water permeability, with more ADH causing more water reabsorption and smaller, more concentrated urine.
What to do in an assessment
- Trace blood and urine routes on the labelled figures, including aorta/vena cava and renal artery/vein flow; label the kidney section.
- Interpret urine volume/concentration without confusing these measurements; connect dehydration to ADH only for Higher tier.
In plain language
Trace blood and urine routes on the labelled figures, including aorta/vena cava and renal artery/vein flow; label the kidney section.; Interpret urine volume/concentration without confusing these measurements; connect dehydration to ADH only for Higher tier.
Self-check
Which tube carries urine from a kidney to the bladder?
Show the answer
The ureter carries urine from each kidney to the bladder.
View diagrams
Human urinary systemSimplified schematic; not to scale. Blood flow: heart → aorta → renal arteries → kidneys → renal veins → vena cava → heart. - A
- B
- C
- D
- E
- F
- G
- H
- I
Show labelled key: Answer key for urinary-system
Human urinary systemSimplified schematic; not to scale. Blood flow: heart → aorta → renal arteries → kidneys → renal veins → vena cava → heart. - AKidney
- BUreter
- CUrinary bladder
- DUrethra
- EKidney
- FAorta
- GVena cava
- HRenal arteries
- IRenal veins
Section through a kidneySimplified schematic; not to scale. - A
- B
- C
- D
- E
- F
Show labelled key: Answer key for kidney-section
Section through a kidneySimplified schematic; not to scale. - ARenal cortex
- BRenal medulla
- CRenal pelvis
- DUreter
- ERenal artery
- FRenal vein
Urinary and kidney-section keys show the aorta/vena cava, renal artery/vein routes, cortex, medulla, pelvis and ureter. The dedicated Higher nephron figure appears only in the Unit 2 Higher supplement; final geometry and label-arrow review passed.
Topic group
Sexual and asexual reproduction
- Core
Scope: Core · §2.2 Unit 2, 2.4 Variation and evolution
Open revision guidance
What to know
- Sexual reproduction combines genetic material from gametes and produces varied offspring; asexual reproduction uses one parent and usually produces genetically similar clones.
- In sexual reproduction, gametes fuse at fertilisation; meiosis and random fertilisation contribute to variation. Asexual offspring arise without gamete fusion.
What to do in an assessment
- Compare parent number, gametes/fertilisation and genetic similarity of offspring; use these distinctions when explaining variation.
In plain language
Compare parent number, gametes/fertilisation and genetic similarity of offspring; use these distinctions when explaining variation.
Self-check
Why are offspring from sexual reproduction genetically varied?
Show the answer
They inherit combinations of alleles from two gametes; meiosis and random fertilisation produce different combinations.
Topic group
Genes, inheritance and cell division
- Core
Scope: Core · §2.2 Unit 2, 2.2 Cell division and stem cells; 2.3 DNA and inheritance (including 2.3j sex determination)
Open revision guidance
What to know
- Genes are sections of DNA along linear chromosomes that influence inherited traits; alleles are alternative forms of a gene. Chromosomes occur in pairs in body cells. Gametes carry one of each pair. Key terms: dominant/recessive, homozygous/heterozygous, genotype/phenotype, F1/F2 and selfing.
- For a single gene, use allele symbols, parental genotypes and a Punnett square to find possible offspring genotypes/phenotypes. Each conception is a probability, not a guaranteed sequence; many traits involve multiple genes.
- Human sex determination: the sex chromosomes are XX in a female and XY in a male; egg cells carry X and sperm carry X or Y, combining randomly at fertilisation.
- Selfing means fertilisation using gametes from the same organism; F1 and F2 denote successive offspring generations. Use these terms consistently in a genetic cross.
What to do in an assessment
- Draw a monohybrid cross by listing gametes, combining alleles and giving genotype/phenotype ratio or probability.
- Use an appropriate family-tree key to trace inheritance and separate observed phenotype from inferred genotype.
In plain language
Draw a monohybrid cross by listing gametes, combining alleles and giving genotype/phenotype ratio or probability.; Use an appropriate family-tree key to trace inheritance and separate observed phenotype from inferred genotype.
Self-check
For Aa × Aa, what is the chance of an aa offspring?
Show the answer
The four equally likely combinations are AA, Aa, Aa and aa, so aa has probability 1/4 (25%) per conception.
Topic group
Variation, selection and evolution
- Core
Scope: Core · §2.2 Unit 2, 2.4 Variation and evolution; 2.3(j) sex determination is mapped separately to the inheritance requirement
Open revision guidance
What to know
- Variation within a species can be genetic, environmental or both. Higher-tier only: classify variation as continuous or discontinuous. Sexual reproduction creates genetic variation; asexual reproduction usually produces genetically similar clones from one parent.
- For a variation practical, measure or classify the same characteristic in a suitable sample using consistent apparatus/categories; record enough observations, display distributions and compare mean/spread only when appropriate.
- Random mutations create new alleles; most are neutral or harmful, some beneficial. Ionising radiation can increase mutation rate. Inherited mutations can cause cystic fibrosis; interpret a family pedigree and evaluate gene therapy cautiously.
- Higher-tier only: distinguish continuous from discontinuous variation using measured or categorical examples.
- Darwin and Wallace independently developed the theory of evolution by natural selection: individuals vary, some variation is inherited, more offspring are produced than survive, and individuals with advantageous inherited features tend to survive and reproduce more; over generations the feature becomes more common.
- Greater knowledge of the human genome may help identify disease-associated genes, but potential benefits must be weighed against privacy, discrimination and uncertain interpretation.
- A camouflage model can test how background affects predator detection: use the same prey number/size, background, search time and predator method, then count prey found; repeated trials support comparison. It is a simplified model and does not reproduce all natural behaviours.
What to do in an assessment
- Explain a resistance example through variation → selection pressure → differential reproduction → inherited change; avoid saying organisms adapt because they need to.
- Use a pedigree key and state what family pattern supports while noting that incomplete family information can limit certainty.
In plain language
Explain a resistance example through variation → selection pressure → differential reproduction → inherited change; avoid saying organisms adapt because they need to.; Use a pedigree key and state what family pattern supports while noting that incomplete family information can limit certainty.
Self-check
Why can resistant bacteria become common after an antibiotic is used?
Show the answer
Some bacteria already carry a resistance variant; they survive and reproduce more, passing the allele on so its frequency rises.
Topic group
Ecology, cycles and biodiversity
- Core
Scope: Core · §2.1 Unit 1, 1.6 Ecosystems and nutrient cycles
Open revision guidance
What to know
- A food chain/web shows feeding relationships and energy flow. The first consumer eats a producer; second and third consumers feed on lower-level consumers. Herbivores eat plants; carnivores eat animals; decomposers act on dead organisms and waste.
- Biomass and energy are lost between trophic levels through respiration, waste and uneaten material. Decomposers recycle minerals. Photosynthesis removes carbon dioxide from air; respiration and decomposition return it; combustion releases carbon stored in fossil fuels.
What to do in an assessment
- Trace food-chain arrows in the direction of energy transfer; identify producer, first/second/third consumer, herbivore/carnivore and decomposer.
- Explain a carbon-cycle transfer by naming the process and direction; distinguish matter cycling from one-way energy flow.
In plain language
Trace food-chain arrows in the direction of energy transfer; identify producer, first/second/third consumer, herbivore/carnivore and decomposer.; Explain a carbon-cycle transfer by naming the process and direction; distinguish matter cycling from one-way energy flow.
Self-check
Why is less energy available at a higher trophic level?
Show the answer
Organisms use energy in respiration and movement, and material is lost in waste, so not all biomass is transferred to the next level.
View diagrams
Food web Food webHypothetical habitat · schematic, not to scaleTarget Organism Trophic role A ________________ ________________ B ________________ ________________ C ________________ ________________ D ________________ ________________ E ________________ ________________ F ________________ ________________ G ________________ ________________ Food → Consumer A B B C C D A E E F B G G D Show labelled key: Answer key for food-web
Food web Food webHypothetical habitat · schematic, not to scaleTarget Organism Trophic role A Grass Producer B Grasshopper Primary consumer C Frog Secondary consumer D Snake Tertiary consumer E Rabbit Primary consumer F Fox Secondary consumer G Bird Secondary consumer Food → Consumer Grass Grasshopper Grasshopper Frog Frog Snake Grass Rabbit Rabbit Fox Grasshopper Bird Bird Snake Pyramids of numbers and biomass Pyramid of numbers
Pyramid of biomass
Hypothetical practice values only: not an actual ecosystem sample or official statistics. Numbers count organisms; biomass is total dry mass. Both examples show three trophic levels and use proportionally scaled bar widths.
Trophic level Number of organisms Biomass (g dry mass) Grass plants 1,000 10,000 Grasshoppers 100 1,000 Small birds 10 100 Show labelled key: Answer key for trophic-pyramids
Pyramids of numbers and biomass Pyramid of numbers
Pyramid of biomass
Hypothetical practice values only: not an actual ecosystem sample or official statistics. Numbers count organisms; biomass is total dry mass. Both examples show three trophic levels and use proportionally scaled bar widths.
Trophic level Number of organisms Biomass (g dry mass) Grass plants 1,000 10,000 Grasshoppers 100 1,000 Small birds 10 100 Practise trophic-role and food-web interpretation and identify trophic levels in the pyramid diagrams.
Topic group
Practical planning and data
- Core
Open revision guidance
What to know
- Enquiry begins with a question/hypothesis and a model; plan a method with a range, suitable apparatus, independent variable, measurable dependent variable, controlled variables and a control experiment when useful.
- Appendix A scientific equipment skill: recognise scientific quantities (such as length, mass, time, temperature and volume), choose how each is determined and select/read suitable instruments with their units and resolution.
- Appendix B terms: independent variable (changed), dependent variable (measured), controlled variable (kept constant), control experiment (the independent variable is removed or held constant while other method variables are unchanged), hypothesis (testable prediction), range (highest and lowest values of the independent variable tested), valid conclusion (supported by valid method/data), validity of design (tests the intended question), resolution (smallest detectable change), anomaly (result inconsistent with pattern), true value (accepted value), uncertainty (range of plausible values), measurement error, systematic error (consistent bias) and random error (unpredictable variation).
- Further Appendix B terms: accuracy is closeness to the true value; inaccuracy means the result is a long way from the true value; precision is closeness of repeated values; repeatability is agreement on repeating under same method/conditions; reproducibility is agreement when method/conditions or investigator change. A hazard can cause harm; risk is a step in a method involving a hazard that might cause danger; assess likelihood and severity as well; control measures reduce risk.
- Repeated measurements can reduce the effect of random error on an estimate, but repetition does not remove a systematic error or bias; precision and repeatability are not the same as accuracy.
- Appendix A covers: how models/theories develop; solving problems and predicting/explaining; limits, power and ethical issues; everyday applications; personal/social/economic/environmental consequences and evidence-based decisions; practical/societal risk including perceived risk versus evidence; peer review and communication to audiences. Use theories to develop hypotheses and appropriate scientific vocabulary.
- Plan experiments/procedures for observation, identification, hypothesis tests, data checks or phenomena; select techniques/apparatus/materials; set up safely and measure accurately; sample representatively; record observations and quantities; evaluate methods and suggest improvements/further work.
- Eight assessed Scientific Enquiry Skills: identify benefits/challenges of enquiry; explore models/factors; make informed decisions; explore/select method designs; collect/record/present/evaluate primary data; gather/present/evaluate secondary data; analyse data; form conclusions/evaluate approaches.
- Present data appropriately, translate between forms, conduct mathematical analysis, represent distributions/comment on uncertainty, interpret primary/secondary patterns and trends, draw evidence-based conclusions, explain data against hypotheses, assess accuracy/precision/repeatability/reproducibility and random/systematic error, and communicate investigation rationale/methods.
- Maths: decimals, standard form, ratios/fractions/percentages, arithmetic means, tables/diagrams, sampling and simple probability, order-of-magnitude, equation substitution with appropriate units, translate/plot/interpret graphs and slope, and calculate triangle/rectangle area, cube volume and surface area.
- 2027 assessment boundary: the original 10% Unit 3 is untiered, centre-delivered and externally marked; learners undertake a scientific-enquiry assessment containing practical and written tasks. This guide can teach method planning, data handling and evaluation for preparation, but reading cannot perform the practical, complete the assessment or demonstrate practical competence. The replacement Unit 3 first awarded in 2028 is not part of this cohort.
- Appendix A §2(16): evaluate measurements objectively from evidence—consider accuracy, precision, repeatability/reproducibility, identify random/systematic error, and justify any judgement with data rather than opinion.
What to do in an assessment
- Change one independent variable, measure the dependent variable with suitable resolution and units, control other factors, sample sufficiently and repeat; identify a control where it answers the question.
- Record raw results with headings/units; choose table/graph, calculate appropriate mean/range/percentage, plot axes and scales, identify patterns/anomalies and cite data in a conclusion.
- Evaluate reliability, repeatability, reproducibility, accuracy, precision, uncertainty, systematic/random errors and validity separately; propose a specific improvement linked to the limitation.
- State hazard, risk and a control measure; use scientific terms and communicate rationale, method and evidence to the intended audience.
- For calculations show the relationship, substitution and units; convert graph forms accurately and explain what a slope means in context.
- For preparation, rehearse a rationale, safe method, data record, analysis, evidence-based conclusion and realistic improvement; the centre-delivered original Unit 3 practical/written assessment must still be completed and externally marked.
In plain language
Change one independent variable, measure the dependent variable with suitable resolution and units, control other factors, sample sufficiently and repeat; identify a control where it answers the question.; Record raw results with headings/units; choose table/graph, calculate appropriate mean/range/percentage, plot axes and scales, identify patterns/anomalies and cite data in a conclusion.; Evaluate reliability, repeatability, reproducibility, accuracy, precision, uncertainty, systematic/random errors and validity separately; propose a specific improvement linked to the limitation.; State hazard, risk and a control measure; use scientific terms and communicate rationale, method and evidence to the intended audience.; For calculations show the relationship, substitution and units; convert graph forms accurately and explain what a slope means in context.; For preparation, rehearse a rationale, safe method, data record, analysis, evidence-based conclusion and realistic improvement; the centre-delivered original Unit 3 practical/written assessment must still be completed and externally marked.
Self-check
Three repeated measurements are 4.8, 5.0 and 5.2 cm. Calculate the mean and identify one useful reporting point.
Show the answer
Mean = (4.8 + 5.0 + 5.2) ÷ 3 = 5.0 cm. Include the unit and report the repeat spread/uncertainty when relevant; the values are repeatable and there is no obvious anomaly.
Topic group
Artificial gene transfer
- Core
Scope: Core · §2.2 Unit 2, 2.3 DNA and inheritance
Open revision guidance
What to know
- Artificial gene transfer moves a selected gene into an organism’s DNA so it may express a desired characteristic; a vector such as a plasmid can carry the gene.
- Potential benefits include producing useful medical or agricultural products; possible ecological, economic and ethical issues must be evaluated, including unintended spread or effects.
What to do in an assessment
- Describe donor gene → vector/transfer → recipient organism → expressed feature; distinguish a potential benefit from demonstrated evidence.
- Evaluate a proposal with both intended benefit and possible risk; do not describe gene transfer as ordinary selective breeding.
In plain language
Describe donor gene → vector/transfer → recipient organism → expressed feature; distinguish a potential benefit from demonstrated evidence.; Evaluate a proposal with both intended benefit and possible risk; do not describe gene transfer as ordinary selective breeding.
Self-check
What is the purpose of a vector in artificial gene transfer?
Show the answer
It carries the selected gene into the recipient cell so the gene can be inserted and expressed.
Topic group
Ecological relationships and nutrient cycles
- Core
Scope: Core · §2.1 Unit 1, 1.6 Ecosystems and nutrient cycles
Open revision guidance
What to know
- Bacteria and fungi decompose dead organisms and waste; they respire and release carbon dioxide, and make mineral nutrients available again.
- Nitrates and phosphates can be recycled through soil, water, plants, consumers and decomposition; stable ecosystems depend on nutrients being returned as they are taken up.
- Carbon cycles between atmospheric carbon dioxide and organisms: photosynthesis fixes carbon; respiration, decomposition and fossil-fuel combustion release it. The specification’s detailed nitrogen-cycle statement is Higher-tier Unit 1 content in the selector-specific supplement.
What to do in an assessment
- Label a carbon cycle with chemical forms, organisms and process arrows; explain a change caused by an activity.
- Distinguish carbon cycling and nutrient return; Higher-tier nitrogen-cycle details are in the Unit 1 Higher supplement.
In plain language
Label a carbon cycle with chemical forms, organisms and process arrows; explain a change caused by an activity.; Distinguish carbon cycling and nutrient return; Higher-tier nitrogen-cycle details are in the Unit 1 Higher supplement.
Self-check
How do decomposers return carbon to the atmosphere?
Show the answer
They respire while breaking down organic material and release carbon dioxide.
Topic group
Human impacts and conservation
- Core
Scope: Core · §2.1 Unit 1, 1.6 Ecosystems and nutrient cycles
Open revision guidance
What to know
- Human activity can change populations and biodiversity. Intensive farming may use fertilisers, pesticides, disease control and intensive animal-rearing/battery methods to increase yield; weigh food and economic-development needs against effects on wildlife, habitats, animal welfare and pollution.
- Stream pollution can be investigated using indicator organisms, pH and dissolved oxygen; lichens can indicate air pollution. Heavy metals from industry/pesticides can accumulate along food chains to toxic concentrations.
- Eutrophication: sewage/fertiliser adds nutrients, algae grow and then die, decomposers use dissolved oxygen, and aquatic animals may suffocate. Conservation and development decisions balance food/economic needs with wildlife.
What to do in an assessment
- For pollution data identify indicator, direction of change and supported inference; avoid treating one indicator as proof of a single cause.
- Explain eutrophication in causal order and connect a control measure to nutrient entry; compare farm yield with ecological effect.
- Discuss an environmental trade-off using evidence and identify who or what is affected.
In plain language
For pollution data identify indicator, direction of change and supported inference; avoid treating one indicator as proof of a single cause.; Explain eutrophication in causal order and connect a control measure to nutrient entry; compare farm yield with ecological effect.; Discuss an environmental trade-off using evidence and identify who or what is affected.
Self-check
Why can a wildlife corridor help a fragmented population?
Show the answer
It can reconnect habitats, allowing organisms to move between groups and maintaining gene flow.
Topic group
Sampling populations fairly
- Core
Scope: Core · §2.1 Unit 1, 1.6 Ecosystems and nutrient cycles; Appendix A Scientific Enquiry and Appendix C mathematics
Open revision guidance
What to know
- Quadrats estimate abundance or percentage cover in a defined area; random placement reduces selection bias. Transects sample change along an environmental gradient.
- Use a sufficient representative sample and the same quadrat area, placement rule and effort for fair site comparisons. Mean density can be calculated from organisms counted divided by sampled area.
- Capture–recapture estimates population size from marked and recaptured animals; Higher-tier calculation and assumptions are taught in the Unit 2 supplement.
What to do in an assessment
- Choose random quadrats for an area estimate or a systematic transect for a gradient; record species, abundance, area and sample number.
- Calculate mean density per unit area; compare with equal effort and state sampling limitations or possible bias.
In plain language
Choose random quadrats for an area estimate or a systematic transect for a gradient; record species, abundance, area and sample number.; Calculate mean density per unit area; compare with equal effort and state sampling limitations or possible bias.
Self-check
Why use systematic quadrats along a transect from shore inland?
Show the answer
The transect samples a defined gradient, showing how abundance changes with distance from the shore.
Topic group
Microscope practical and drawing
- Core
Scope: Core · §2.1 Unit 1, 1.1 Cells and movement across membranes; specified practical work
Open revision guidance
What to know
- Prepare a thin animal or plant specimen on a slide, add stain where appropriate, lower a coverslip carefully and focus first at low power before increasing magnification.
- A scientific drawing uses clear single lines, accurate relative proportions, no shading and labels that touch the relevant structure; include a title and magnification or scale where requested.
What to do in an assessment
- Observe and identify structures in the field of view; make a labelled drawing only of visible evidence and distinguish plant features from animal-cell structures.
- Use scale bars or matching units for size calculations; keep the microscope and slide safely handled.
In plain language
Observe and identify structures in the field of view; make a labelled drawing only of visible evidence and distinguish plant features from animal-cell structures.; Use scale bars or matching units for size calculations; keep the microscope and slide safely handled.
Self-check
Why focus first with the lowest-power objective?
Show the answer
It provides a wider field of view and makes it easier and safer to find and focus the specimen.
View diagrams
Companion photograph
Practice question
Compare the two plant-cell micrographs. In the onion epidermis, what are the clear outer boundaries and dark spots? In the Elodea leaf cells, what are the many green bodies, and what do the broad clear central regions resemble?
Photograph / micrograph recognition only. Neither image separately resolves the plasma membrane from the cell wall. Onion cytoplasm and vacuole are not distinguishable here; the Elodea cytoplasm and any nucleus are not clearly resolved. Do not claim the Elodea photo shows a nucleus.
Photo: Onion skin cells under a microscope · Katekor1Stained Allium cepa (onion) epidermis light micrograph.Photo: Chloroplasts - Microscopic view of Elodea canadensis · Juan Carlos Fonseca MataElodea canadensis leaf cells; source identifies chloroplasts.Show labelled key: Answer key for plant-cell-micrographs
Plant cells: onion epidermis and Elodea leaf
Chloroplasts - Microscopic view of Elodea canadensis
Photo key
The onion epidermis shows cell walls and nuclei. The Elodea leaf micrograph shows cell walls, many chloroplasts, and broad clear central regions consistent with vacuoles. The onion bulb epidermis does not normally contain chloroplasts. A nucleus is not clearly resolved in the Elodea image.
Neither image separately resolves the plasma membrane from the cell wall. Onion cytoplasm and vacuole are not distinguishable here; the Elodea cytoplasm and any nucleus are not clearly resolved. Do not claim the Elodea photo shows a nucleus.
Photo: Onion skin cells under a microscope · Katekor1Stained Allium cepa (onion) epidermis light micrograph.Photo: Chloroplasts - Microscopic view of Elodea canadensis · Juan Carlos Fonseca MataElodea canadensis leaf cells; source identifies chloroplasts.Practice question
In the clearest central cheek cell, identify the purple-stained structure, the pale interior, and the visible outer cell boundary.
Photograph / micrograph recognition only. This is a real microscope photograph of a human cheek-cell sample, not a model. The cell surface membrane cannot be distinguished separately from the outer boundary. The image has no scale bar and the source gives no stain information.
Photo: Human cheek cells from science class · KyrebSource describes a microscope photograph of the photographer’s own inner-cheek sample.Show labelled key: Answer key for animal-cell-micrograph
Human cheek-cell micrograph
Photo key
The purple-stained structure is the nucleus; the pale interior is cytoplasm. The cell boundary is visible, but the membrane is not separately resolved as a bilayer.
This is a real microscope photograph of a human cheek-cell sample, not a model. The cell surface membrane cannot be distinguished separately from the outer boundary. The image has no scale bar and the source gives no stain information.
Photo: Human cheek cells from science class · KyrebSource describes a microscope photograph of the photographer’s own inner-cheek sample.Practice question
What overall shape do the visible bacteria have? What does the scale annotation help you estimate?
Photograph / micrograph recognition only. The organism is identified by the source as cultured E. coli. This SEM does not reveal internal structures. Use the bacterial-cell schematic for cell contents; do not label DNA or plasmids on this photograph.
Photo: E. coli Bacteria (7316101966) · NIAIDScanning electron micrograph; the original image includes a 2.00 µm scale annotation.Show labelled key: Answer key for bacterial-cell-micrograph
E. coli scanning electron micrograph
Photo key
The image shows rod-shaped Escherichia coli. The printed scale annotation represents 2.00 µm. This scanning electron micrograph shows the outer form only; it does not show cytoplasm, DNA, a nucleoid, or plasmids.
The organism is identified by the source as cultured E. coli. This SEM does not reveal internal structures. Use the bacterial-cell schematic for cell contents; do not label DNA or plasmids on this photograph.
Photo: E. coli Bacteria (7316101966) · NIAIDScanning electron micrograph; the original image includes a 2.00 µm scale annotation.Observe actual cell micrographs, then practise a scientific drawing of visible features with a title and labels; photographs are examples, not substitutes for learner observation.
Topic group
Visking tubing and membrane models
- Core
Scope: Core · §2.1 Unit 1, 1.1 Movement across membranes
Open revision guidance
What to know
- Visking tubing is a model partially permeable membrane with pores: small molecules may diffuse through but larger molecules are retained. The result depends on molecule size, concentration gradient and time.
- In a starch/iodine model, iodine molecules can enter tubing and react with starch; the large starch molecules do not pass out. A glucose test on surrounding solution can show movement of small sugar molecules where present.
- A model demonstrates selective passage but does not reproduce a living cell membrane’s transport proteins, energy use or active transport.
What to do in an assessment
- Tie and leak-test tubing, add the chosen solution, rinse the outside, immerse it in a known test solution for a set time, then test both inside/outside with suitable reagents and controls.
- State which substance crossed, evidence for it and a model limitation; do not infer osmosis if the measured process is diffusion of solute.
In plain language
Tie and leak-test tubing, add the chosen solution, rinse the outside, immerse it in a known test solution for a set time, then test both inside/outside with suitable reagents and controls.; State which substance crossed, evidence for it and a model limitation; do not infer osmosis if the measured process is diffusion of solute.
Self-check
Why can iodine enter starch-containing Visking tubing while starch remains inside?
Show the answer
Iodine molecules are small enough to pass through the pores; starch molecules are too large and are retained.
Topic group
Food tests, nutrition and energy
- Core
Scope: Core · §2.1 Unit 1, 1.3 Digestion and digestive system; specified energy-content practical
Open revision guidance
What to know
- Food tests: iodine solution changes from orange-brown to blue-black with starch; Benedict’s reagent with heat detects reducing sugar (blue to green/yellow/orange/brick-red); biuret reagent changes blue to lilac/purple for protein.
- A balanced diet supplies carbohydrate, fat and protein, plus iron, vitamin C, fibre and water. Fatty acids/glycerol can be respired; glucose can be respired or stored as glycogen; amino acids make body proteins.
- Foods contain different chemical energy; excess energy can be stored as body fat. Excess sugar, fat or salt carries health risks.
- In food-energy practicals, a known mass of food heats a known mass of water; temperature rise estimates transferred energy (water energy = mass × 4.2 × temperature change, in joules when mass is grams). Combustion heat loss makes this an underestimate.
What to do in an assessment
- Use a fresh portion and the specified reagent/control for each food test; report the observed colour and inference separately.
- For a fair energy comparison, keep water volume, starting temperature and distance from flame constant; record food mass burned and water temperature rise; repeat and compare energy per gram.
In plain language
Use a fresh portion and the specified reagent/control for each food test; report the observed colour and inference separately.; For a fair energy comparison, keep water volume, starting temperature and distance from flame constant; record food mass burned and water temperature rise; repeat and compare energy per gram.
Self-check
A sample turns blue-black with iodine and purple with biuret. What two food groups are indicated?
Show the answer
Starch and protein.
Topic group
Blood components and cardiovascular health
- Core
Scope: Core · §2.1 Unit 1, 1.4 Circulatory system in humans
Open revision guidance
What to know
- Phagocytes have a nucleus and engulf pathogens; red blood cells are biconcave and contain haemoglobin to carry oxygen. White cells defend against pathogens; platelets enable clotting; plasma transports dissolved substances, nutrients, hormones, wastes and cells.
- Heart muscle contracts; coronary arteries supply its muscle. Label right/left atria and ventricles, septum, tricuspid/bicuspid and semilunar valves, vena cava, pulmonary artery/vein and aorta. Trace double circulation: body → vena cava → right heart → pulmonary artery → lungs → pulmonary vein → left heart → aorta → body.
- Arteries have thick elastic muscular walls and narrower lumens for high pressure; veins have thinner walls, wider lumens and valves for low-pressure return; capillaries have a one-cell-thick wall and narrow lumen for exchange. Networks bring blood close to cells and shorten diffusion paths.
- Coronary artery narrowing reduces oxygen delivery to heart muscle and may cause a heart attack; cardiovascular disease effects/risk relate to blood supply and heart/vessel function. Statins lower blood cholesterol; angioplasty opens narrowed coronary vessels; compare benefits and risks with lifestyle changes.
What to do in an assessment
- On a micrograph identify a phagocyte versus a red blood cell from visible structure; make a labelled drawing with accurate proportions and label only observed features.
- On a heart diagram trace the route in order and mark where blood is oxygenated; explain pulmonary arteries/veins as exceptions to usual oxygen-content patterns.
- For a treatment comparison, use the same outcome (e.g. reduced blockage/risk) and weigh effectiveness, risk, cost and need for continued treatment.
In plain language
On a micrograph identify a phagocyte versus a red blood cell from visible structure; make a labelled drawing with accurate proportions and label only observed features.; On a heart diagram trace the route in order and mark where blood is oxygenated; explain pulmonary arteries/veins as exceptions to usual oxygen-content patterns.; For a treatment comparison, use the same outcome (e.g. reduced blockage/risk) and weigh effectiveness, risk, cost and need for continued treatment.
Self-check
Why is the left ventricle wall thicker than the right?
Show the answer
It generates pressure to send blood through the systemic circulation, whereas the right ventricle pumps only to the lungs.
View diagrams
Section through the human heartSimplified schematic; not to scale. - A
- B
- C
- D
- E
- F
- G
- H
- I
- J
- K
- L
- M
- N
Show labelled key: Answer key for heart-section
Section through the human heartSimplified schematic; not to scale. - ARight atrium
- BRight ventricle
- CLeft atrium
- DLeft ventricle
- ESeptum
- FMuscular wall
- GTricuspid valve
- HBicuspid (mitral) valve
- ISemilunar valves
- JCoronary arteries
- KVena cava
- LPulmonary artery
- MPulmonary vein
- NAorta
Double circulation and major vesselsColour indicates oxygenation, not artery or vein type. Simplified schematic; not to scale. - A
- B
- C
- D
- E
- F
- G
- H
- I
- J
- K
- L
- M
- N
Show labelled key: Answer key for circulation-vessels
Double circulation and major vesselsColour indicates oxygenation, not artery or vein type. Simplified schematic; not to scale. - AHeart
- BLungs
- CPulmonary artery: heart → lungs
- DPulmonary vein: lungs → heart
- EAorta: away from heart
- FVena cava: to heart
- GGut
- HHepatic portal vein: gut → liver
- ILiver
- JHepatic artery: to liver
- KHepatic veins: from liver
- LKidney
- MRenal artery: to kidney
- NRenal vein: from kidney
Blood cells: schematic, not a photomicrographSchematic shapes only. Actual representative photomicrographs must be supplied separately; this drawing is not a specimen. - A
- B
- C
- D
- E
- F
Show labelled key: Answer key for blood-cells
Blood cells: schematic, not a photomicrographSchematic shapes only. Actual representative photomicrographs must be supplied separately; this drawing is not a specimen. - ARed blood cell: biconcave, no nucleus
- BPhagocyte
- CPhagocyte nucleus
- DLymphocyte
- ELymphocyte nucleus
- FPlatelets
Practice question
Compare the many pale disc-shaped cells with the larger purple-stained cell near the centre. Which is the red blood cell type, and what kind of white blood cell is visible?
Photograph / micrograph recognition only. This small unlabelled field contains erythrocytes and a neutrophil, not a lymphocyte. No scale bar is shown.
Photo: Blood-neutrophil1 · EchinaceapallidaWright-stained human peripheral blood smear.Show labelled key: Answer key for blood-smear-micrograph
Human blood smear
Photo key
The numerous pale cells are erythrocytes (red blood cells). The larger purple-stained cell is a neutrophil, identified by its segmented nucleus.
This small unlabelled field contains erythrocytes and a neutrophil, not a lymphocyte. No scale bar is shown.
Photo: Blood-neutrophil1 · EchinaceapallidaWright-stained human peripheral blood smear.
Practice question
Inspect the prominent purple-stained white blood cell. What shape does its dark-stained nucleus have?
Photograph / micrograph recognition only. Small, tightly framed micrograph; only part of the surrounding smear is visible. No scale bar or specimen scale is given.
Photo: Neutrophil in a blood smear · Original image: hematologist (Segmented_neutrophils.jpg); derivative work: patient-docDerivative image; source page credits the original image and derivative work.Show labelled key: Answer key for neutrophil-micrograph
Neutrophil in a blood smear
Photo key
It is a neutrophil. The visible nucleus is segmented into several lobes; nearby erythrocytes provide context, not a scale reference.
Small, tightly framed micrograph; only part of the surrounding smear is visible. No scale bar or specimen scale is given.
Photo: Neutrophil in a blood smear · Original image: hematologist (Segmented_neutrophils.jpg); derivative work: patient-docDerivative image; source page credits the original image and derivative work.
Practice question
Compare the lymphocyte with the surrounding red blood cells. What can you observe about its dark central region and the amount of cytoplasm around it?
Photograph / micrograph recognition only. The image does not include a scale bar. No donor health status or diagnosis is provided by the source.
Show labelled key: Answer key for lymphocyte-micrograph
Lymphocyte in a human blood smear
Photo key
The cell is a human lymphocyte. It has a prominent, rounded dark nucleus and a narrow rim of cytoplasm. The source does not identify the donor’s health status.
The image does not include a scale bar. No donor health status or diagnosis is provided by the source.
The heart/vessel keys include named valves and major vessels; blood-cell diagrams and authentic micrographs support cell-recognition practice. Identify only visible evidence in micrographs.
Topic group
Leaf structure, water uptake and mineral nutrition
- Core
Scope: Core · §2.1 Unit 1, 1.5 Plants and photosynthesis
Open revision guidance
What to know
- A leaf cross-section includes cuticle and epidermis, palisade and spongy mesophyll, air spaces, stomata and guard cells, and xylem/phloem in veins. Chloroplasts in palisade cells absorb light; guard cells change pore opening.
- Plants use water in photosynthesis, mineral transport and support. Root-hair extensions give a large absorbing surface; water enters through root cells by osmosis. The separate Unit 1 Higher supplement covers active transport of mineral salts against a gradient.
- Nitrate deficiency limits protein/growth; potassium deficiency causes poor/yellowing leaves; phosphate deficiency restricts root development. NPK fertilisers supply these mineral nutrients.
What to do in an assessment
- Identify cuticle, epidermis, palisade/spongy mesophyll, air spaces, stomata/guard cells and xylem/phloem on a leaf diagram; link structure with function.
- When evaluating a plant-growth result, name nutrient changed, observed symptom and controlled comparison.
In plain language
Identify cuticle, epidermis, palisade/spongy mesophyll, air spaces, stomata/guard cells and xylem/phloem on a leaf diagram; link structure with function.; When evaluating a plant-growth result, name nutrient changed, observed symptom and controlled comparison.
Self-check
How does a root-hair cell help water enter the plant?
Show the answer
Its long extension gives a large contact area with soil; water enters root cells by osmosis.
View diagrams
Dicot leaf section · Unlabelled practice · Schematic, simplified and not to scale. Show labelled key: Answer key for leaf-section
Dicot leaf section · Structure key · Schematic, simplified and not to scale. Non-woody dicot root section · Unlabelled practice · Schematic, simplified and not to scale. Show labelled key: Answer key for dicot-root-section
Non-woody dicot root section · Structure key · Schematic, simplified and not to scale. Root-hair cell · Unlabelled practice · Schematic, simplified and not to scale. Show labelled key: Answer key for root-hair-cell
Root-hair cell · Structure key · Schematic, simplified and not to scale. Practice question
Read the section from its more regular, column-like tissue toward the looser tissue with larger spaces. Which leaf regions can you recognise, and where is the vein?
Photograph / micrograph recognition only. Species is not identified. This is a dicot example, but not a species-specific specimen.
Photo: Dicot leaf · Jon Houseman; source credit also names Matthew FordPhotomicrograph with a 0.2 mm scale bar.Show labelled key: Answer key for leaf-micrograph
Dicot leaf cross-section
Photo key
The source identifies this as a dicot leaf in transverse section. Elongated palisade tissue lies beneath the upper surface; looser spongy tissue with air spaces is toward the lower surface; a central vein is visible. Individual xylem and phloem are not resolved clearly enough here to label.
Species is not identified. This is a dicot example, but not a species-specific specimen.
Photo: Dicot leaf · Jon Houseman; source credit also names Matthew FordPhotomicrograph with a 0.2 mm scale bar.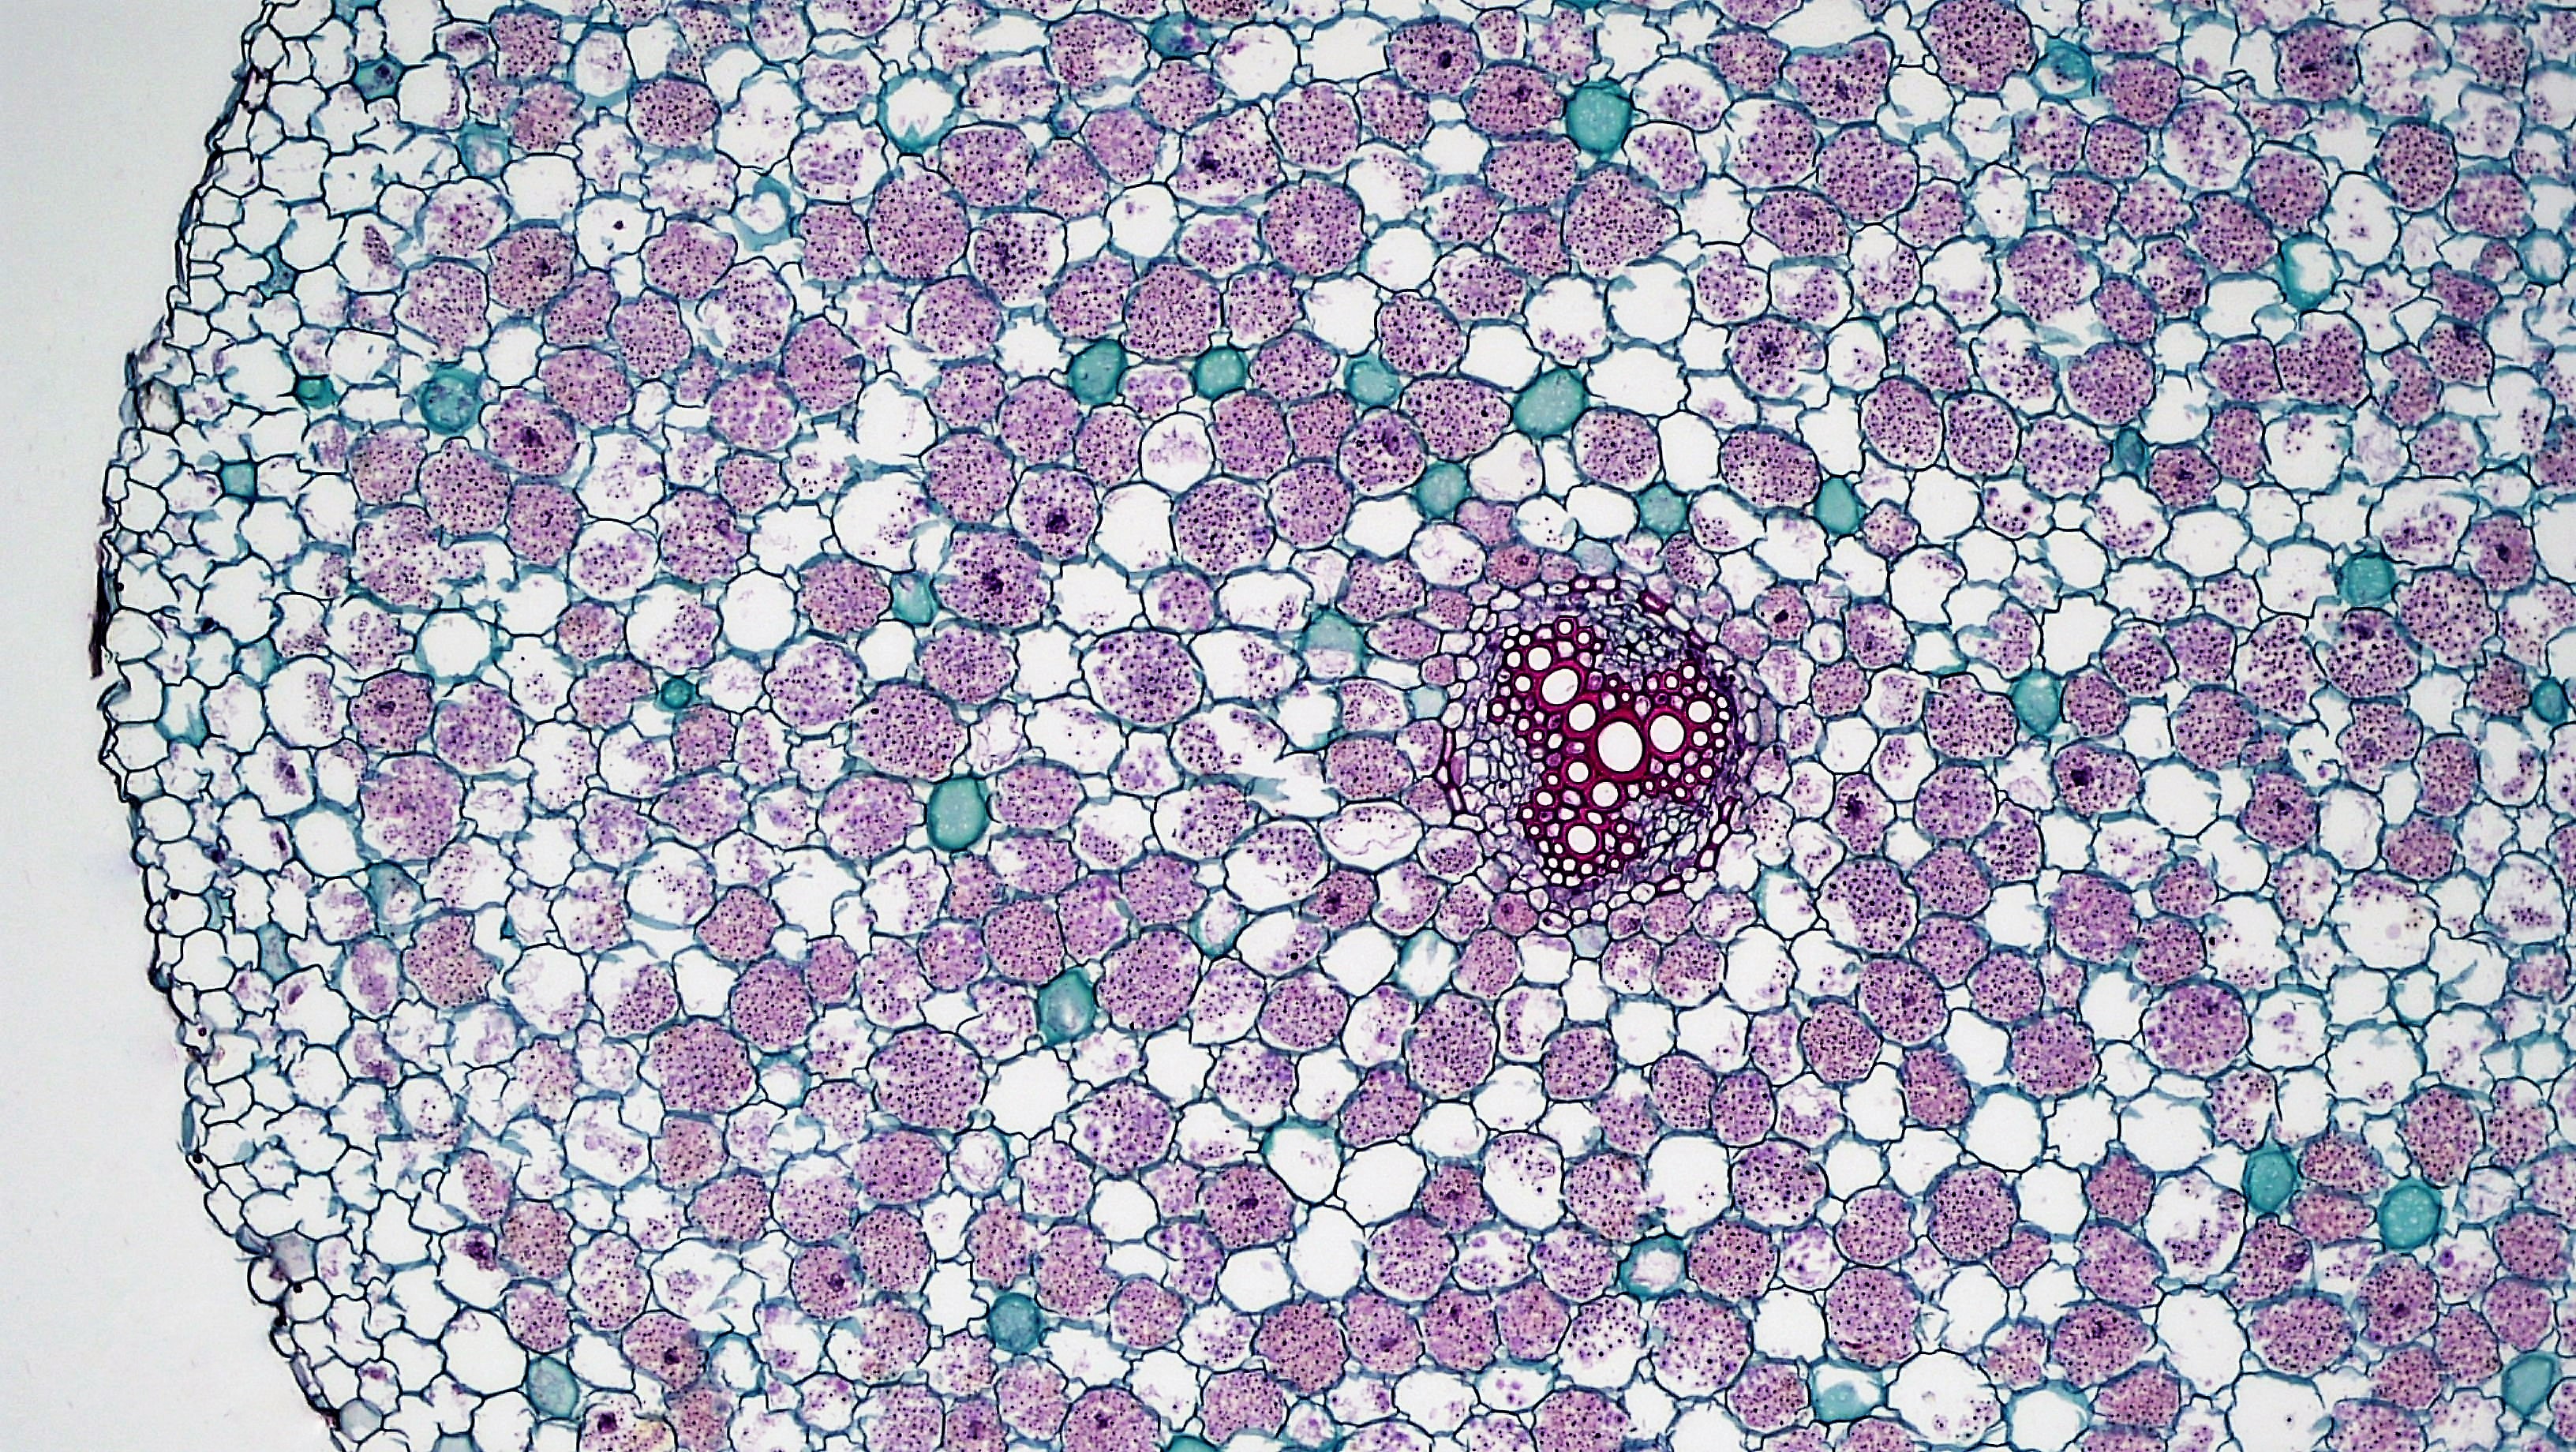
Enlarged view of the same central region
Practice question
Find the compact vascular region at the centre of the section. What arrangement can you recognise there, and how is it positioned relative to the surrounding tissue?
Photograph / micrograph recognition only. The full-frame centre is compact and the arms are easier to inspect in the enlargement below. No scale bar is shown (the source title gives 100×, not a specimen scale). This real specimen is a mature Ranunculus root; do not generalise its exact appearance to every root.
Photo: Herbaceous Dicot Root Mature Ranunculus (100x) · Berkshire Community College Bioscience Image LibrarySource page describes radial vascular bundles.Show labelled key: Answer key for root-micrograph
Mature Ranunculus root cross-section
Enlarged view of the same central region
Photo key
This is a mature Ranunculus (buttercup) root. The enlarged centre shows the vascular region: xylem forms central arms, with phloem between the arms. The photo is unlabelled; boundaries are not drawn on the specimen.
The full-frame centre is compact and the arms are easier to inspect in the enlargement below. No scale bar is shown (the source title gives 100×, not a specimen scale). This real specimen is a mature Ranunculus root; do not generalise its exact appearance to every root.
Photo: Herbaceous Dicot Root Mature Ranunculus (100x) · Berkshire Community College Bioscience Image LibrarySource page describes radial vascular bundles.Practice question
What fine projections extend from the root surface into the surrounding soil? How might many such projections affect contact with soil water and dissolved mineral ions?
Photograph / micrograph recognition only. This macro photograph shows numerous root hairs against soil, not the internal structure or boundary of one individual root-hair cell. No scale is provided.
Photo: Cucurbita maxima root hairs · Josef SchlagheckenClose-up photograph; no scale provided.Show labelled key: Answer key for root-hair-photo
Cucurbita maxima root hairs
Photo key
The fine projections are root hairs. They are extensions of root epidermal cells; their large combined surface area increases contact with soil water and dissolved mineral ions.
This macro photograph shows numerous root hairs against soil, not the internal structure or boundary of one individual root-hair cell. No scale is provided.
Photo: Cucurbita maxima root hairs · Josef SchlagheckenClose-up photograph; no scale provided.Label the leaf/root schematics and practise identification from authentic plant micrographs; only identify structures visible in each image.
Topic group
Energy flow and nutrient cycles
- Core
Scope: Core · §2.1 Unit 1, 1.6 Ecosystems and nutrient cycles
Open revision guidance
What to know
- Energy supports repair, maintenance and growth, but is lost from trophic levels through respiration, waste and uneaten material. Pyramids of numbers and biomass represent trophic levels.
- Decomposers release mineral ions, including nitrates and phosphates, from dead matter/waste. Plants take up nutrients, and food webs return them through feeding and decomposition.
- Carbon cycles between atmospheric carbon dioxide and organisms: photosynthesis fixes carbon; respiration, decomposition and fossil-fuel combustion release it.
What to do in an assessment
- Explain why a pyramid narrows upward using respiration, waste and uneaten material; detailed percentage efficiency calculations are Higher-tier Unit 1 only and appear in that supplement.
- Use arrows in cycles to show substance and process; distinguish one-way energy flow from matter recycling.
In plain language
Explain why a pyramid narrows upward using respiration, waste and uneaten material; detailed percentage efficiency calculations are Higher-tier Unit 1 only and appear in that supplement.; Use arrows in cycles to show substance and process; distinguish one-way energy flow from matter recycling.
Self-check
Why is less energy available at a higher trophic level?
Show the answer
Some material is uneaten or lost in waste, and organisms use energy in respiration and release heat; less biomass/energy is passed to the next level.
Topic group
Classification, adaptation and biodiversity
- Core
Scope: Core · §2.2 Unit 2, 2.1 Classification and biodiversity
Open revision guidance
What to know
- Organisms are classified by shared observable characteristics. Broad groups include flowering and non-flowering plants, and invertebrate and vertebrate animals. A scientific identification system uses standard scientific (binomial) names—genus and species—rather than potentially ambiguous common names, so organisms can be identified consistently across languages/places.
- Biodiversity is variety of living organisms; it can be described by the species present and the number/abundance of each species in a defined area. Biodiversity supports ecosystem stability/resilience and provides resources/ecosystem services important to people.
- Populations depend on resources such as food, water, light, space, shelter and mates; competition, predation, disease and pollution affect population size and distribution. Adaptations may be structural, physiological or behavioural and support survival in particular conditions.
- Endangered species and biodiversity can be protected by habitat management and legislation. Biological control and introduced alien species can have unintended effects on local food webs and wildlife.
- Field studies use observable/shared features or an identification key; abundance and distribution describe different aspects of a population.
What to do in an assessment
- Classify from stated shared characteristics; use the scientific identification system and scientific names, not common names alone.
- In a biodiversity survey record species identity and number in a defined area using consistent sampling.
- When evaluating conservation or biological control, state benefits and possible ecological consequences using evidence.
In plain language
Classify from stated shared characteristics; use the scientific identification system and scientific names, not common names alone.; In a biodiversity survey record species identity and number in a defined area using consistent sampling.; When evaluating conservation or biological control, state benefits and possible ecological consequences using evidence.
Self-check
How does a structural adaptation support survival?
Show the answer
Its feature improves performance in an environment, such as reducing water loss or helping an organism obtain food; link the particular feature to the challenge.
Topic group
Cell division, cancer and stem cells
- Core
Scope: Core · §2.2 Unit 2, 2.2 Cell division and stem cells
Open revision guidance
What to know
- Chromosomes carry genes; body cells have pairs of chromosomes. Mitosis makes genetically identical daughter cells for growth and repair; meiosis makes genetically varied haploid gametes.
- Uncontrolled mitosis can form cancer. Many mature cells lose the ability to differentiate; some plant and animal stem cells can form different specialised cells.
- Adult and embryonic stem cells may replace damaged tissues, but possible benefit must be weighed against medical risks and ethical considerations.
What to do in an assessment
- Compare the number, chromosome content and genetic similarity of products of mitosis and meiosis.
- For a stem-cell proposal, distinguish a possible medical use from evidence of safe/effective treatment and identify an ethical issue.
In plain language
Compare the number, chromosome content and genetic similarity of products of mitosis and meiosis.; For a stem-cell proposal, distinguish a possible medical use from evidence of safe/effective treatment and identify an ethical issue.
Self-check
Which division produces genetically varied gametes?
Show the answer
Meiosis; it produces haploid cells with different combinations of genetic material.
Topic group
DNA structure and genetic profiling
- Core
Scope: Core · §2.2 Unit 2, 2.3 DNA and inheritance
Open revision guidance
What to know
- DNA is a double helix made from two sugar-phosphate strands. The four bases are adenine, thymine, cytosine and guanine (A, T, C and G); base sequence carries genetic information and influences amino-acid order in proteins.
- Higher-tier only: complementary bases pair A–T and C–G; three bases form a triplet that codes for an amino acid during protein synthesis.
- Genetic profiling cuts DNA into fragments and separates them into bands. Similar band patterns provide evidence of DNA similarity; they do not by themselves establish identity without considering method and context.
- Profiling can support criminal investigation, paternity testing, species classification or investigation of disease-associated genes; these uses raise privacy/ethical issues.
What to do in an assessment
- Read a band profile by comparing band positions and state what matches support, without claiming that a band pattern alone proves a conclusion.
- For Higher tier, use complementary pairing/triplet information; distinguish the shared names of DNA bases from the Higher-only code details.
In plain language
Read a band profile by comparing band positions and state what matches support, without claiming that a band pattern alone proves a conclusion.; For Higher tier, use complementary pairing/triplet information; distinguish the shared names of DNA bases from the Higher-only code details.
Self-check
What does a close match between two DNA band profiles support?
Show the answer
That the samples are genetically similar; the strength of an identity or relationship conclusion depends on context and the chance of a coincidental match.
Topic group
Sensory responses, eye and temperature control
- Core
Scope: Core · §2.2 Unit 2, 2.5 Response and regulation
Open revision guidance
What to know
- Receptors detect light, sound, touch, temperature and chemicals; sensory neurones carry impulses to the CNS. Eye parts and functions: sclera protects/supports; cornea refracts light; iris controls pupil size; pupil admits light; lens focuses light on the retina; choroid supplies blood and absorbs stray light; retina contains light receptors; blind spot has no photoreceptors; optic nerve carries impulses to the brain.
- Skin includes hairs, erector muscles, sweat glands/ducts/pores and blood vessels. Sweating and vasodilation increase heat loss; vasoconstriction and hair erection reduce heat loss; shivering generates heat.
- Homeostasis keeps internal conditions relatively constant. Insulin lowers high blood glucose; the Higher-tier glucagon/negative-feedback response appears in the Unit 2 supplement.
- Shoots grow towards light (phototropism) and roots respond to gravity (gravitropism). Unequal auxin distribution in a shoot promotes greater cell elongation on the shaded side, bending the shoot toward light.
What to do in an assessment
- Use eye/skin diagrams to match each labelled structure with its function, including sclera/choroid and sweat duct/pore.
- For temperature regulation name the change and common response; distinguish a plant tropism from an animal reflex.
In plain language
Use eye/skin diagrams to match each labelled structure with its function, including sclera/choroid and sweat duct/pore.; For temperature regulation name the change and common response; distinguish a plant tropism from an animal reflex.
Self-check
What is the function of the retina?
Show the answer
The retina contains light-sensitive receptors that detect light and start nerve impulses.
View diagrams
Section through the human eyeSimplified schematic; not to scale. - A
- B
- C
- D
- E
- F
- G
- H
- I
- J
Show labelled key: Answer key for eye-section
Section through the human eyeSimplified schematic; not to scale. - ACornea
- BIris
- CPupil
- DLens
- ERetina
- FOptic nerve
- GBlind spot
- HFovea
- ISclera
- JChoroid
Section through human skinSimplified schematic; not to scale. - A
- B
- C
- D
- E
- F
- G
- H
- I
Show labelled key: Answer key for skin-section
Section through human skinSimplified schematic; not to scale. - AHair
- BErector muscle
- CSweat gland
- DReceptor
- ESensory neurone
- FBlood vessels
- GFatty tissue
- HSweat duct
- ISweat pore
The eye key includes sclera and choroid among the nine specified structures; the skin key labels sweat duct and pore as well as other temperature-control structures.
Topic group
Kidney failure, treatment and urine testing
- Core
Scope: Core · §2.2 Unit 2, 2.6 Role of kidney in homeostasis; specified artificial-urine practical
Open revision guidance
What to know
- Dialysis can treat kidney failure. Higher-tier only: blood flows past dialysis fluid across a partially permeable membrane; urea diffuses out and the dialysis-fluid concentrations are chosen to maintain useful blood glucose/salts while excess water is removed. A transplant uses a donor kidney; tissue matching and immunosuppressant drugs matter because rejection can occur.
- Compare dialysis and transplant by effectiveness, time/cost, availability, risks and effects on daily life; neither should be described as risk-free.
- Artificial urine can be tested with appropriate reagents for glucose and protein. Record colour/result and inference separately. Blood or cells in urine may indicate kidney disease; glucose may indicate diabetes. Protein is a separate finding and must not be substituted for the source’s blood/cell indicator.
- For the specified artificial-urine practical, Benedict’s reagent with heating tests for glucose (colour change); Biuret reagent tests for protein (blue to lilac/purple). Use controls where supplied and report observation separately from inference.
What to do in an assessment
- Compare dialysis and transplant using effectiveness, time/cost, availability, risks and daily-life effects; detailed dialysis-machine mechanism is Higher-tier only.
- For urine practical, use labelled samples, separate test tubes and controls; follow reagent/heat safety instructions and report observation separately from inference.
In plain language
Compare dialysis and transplant using effectiveness, time/cost, availability, risks and daily-life effects; detailed dialysis-machine mechanism is Higher-tier only.; For urine practical, use labelled samples, separate test tubes and controls; follow reagent/heat safety instructions and report observation separately from inference.
Self-check
Which reagent is used to test an artificial urine sample for protein?
Show the answer
Biuret reagent; a lilac/purple colour indicates protein.
Topic group
Microbial growth and antibiotic testing
- Core
Scope: Core · §2.2 Unit 2, 2.7 Micro-organisms and applications; specified antibiotic practical
Open revision guidance
What to know
- Aseptic technique reduces contamination: disinfect the bench, use sterile nutrient agar/equipment, open a Petri dish minimally, secure it with suitable tape and incubate plates inverted at 25°C in a school laboratory.
- Bacterial colonies arise from growth on agar; colony counts estimate organisms in the original sample only when dilution, plated volume and colony separation are considered.
- Penicillium mould is grown in a fermenter in a sterile nutrient medium under controlled conditions, including suitable temperature, pH, nutrients and oxygen/aeration. Penicillin is released into the broth; filter off fungal mycelium, then separate, purify and crystallise the antibiotic from the filtrate.
- Temperature, pH, oxygen and nutrient supply affect microbial growth; refrigeration slows growth and safe storage reduces food spoilage. In an antibiotic-disc test, clear-zone diameter indicates inhibition under those conditions, not proof that a medicine cures an infection in a patient.
What to do in an assessment
- Measure inhibition-zone diameter consistently, include a control disc, repeat and compare; keep agar type, inoculum, incubation conditions and disc size controlled.
- Describe Penicillium cultivation and extraction in order: controlled sterile fermenter growth → separate mycelium → filter broth → purify/crystallise penicillin.
- Never open or culture plates after incubation; state named contamination/infection hazard and corresponding control.
In plain language
Measure inhibition-zone diameter consistently, include a control disc, repeat and compare; keep agar type, inoculum, incubation conditions and disc size controlled.; Describe Penicillium cultivation and extraction in order: controlled sterile fermenter growth → separate mycelium → filter broth → purify/crystallise penicillin.; Never open or culture plates after incubation; state named contamination/infection hazard and corresponding control.
Self-check
Why incubate a bacterial plate upside down?
Show the answer
It prevents condensation droplets falling onto the agar and spreading colonies.
Topic group
Drug testing and monoclonal antibodies
- Core
Scope: Core · §2.2 Unit 2, 2.8 Disease, defence and treatment
Open revision guidance
What to know
- New medicines can cause side effects and require extensive, carefully controlled testing to establish safety and efficacy. Preclinical tests use cultured human cells/tissues and then animals where justified to identify effects/risks before human testing.
- Clinical testing follows a clear sequence: test a small number of healthy volunteers first (safety/dose); then small groups of patients (initial efficacy/side effects); then larger-scale trials with many patients, suitable comparison/control groups and monitored outcomes. Evaluate sample size, controls, benefit, risk, bias and ethics; use alternatives to animal testing where possible.
- Monoclonal antibodies are identical antibodies with binding sites specific to one antigen. To produce them, activate lymphocytes using an antigen from the target pathogen, isolate an antibody-producing lymphocyte and fuse it with a rapidly dividing tumour cell to form a hybridoma. Select and clone the hybridoma; its descendants divide continuously and secrete identical pathogen-specific antibodies, which are collected and purified.
- Uses include detecting Chlamydia/HIV, tissue typing before transplant, monitoring malaria and supporting cancer treatment. Preventive drugs/therapies can reduce some disease risks, but prevention is distinct from curing an established infection.
What to do in an assessment
- Describe drug testing in order: preclinical cultured cells/tissues → animals where needed → small group of healthy volunteers → small patient groups → larger-scale patient trials; identify controls and objective outcomes.
- Describe monoclonal antibody production: pathogen-derived antigen activates a lymphocyte → select antibody-producing cell → fuse with tumour cell → clone hybridoma → continuous division/secretion → collect specific antibody.
- Evaluate evidence objectively using controls, adequate sample sizes, side effects, outcomes and relevant ethical considerations.
In plain language
Describe drug testing in order: preclinical cultured cells/tissues → animals where needed → small group of healthy volunteers → small patient groups → larger-scale patient trials; identify controls and objective outcomes.; Describe monoclonal antibody production: pathogen-derived antigen activates a lymphocyte → select antibody-producing cell → fuse with tumour cell → clone hybridoma → continuous division/secretion → collect specific antibody.; Evaluate evidence objectively using controls, adequate sample sizes, side effects, outcomes and relevant ethical considerations.
Self-check
Why are monoclonal antibodies described as specific?
Show the answer
Their binding sites match one particular antigen, so they bind that target rather than unrelated antigens.
Topic group
Unit 1 Higher-tier extensions
- Core
Scope: Core · Unit 1 examination tier: Higher Tier · §2.1 Unit 1, Higher-tier statements in 1.1, 1.5 and 1.6
Open revision guidance
What to know
- Higher-tier only: active transport against a concentration gradient; enzyme amino-acid chains with different sequences fold into specific active-site shapes; increased molecular collision frequency explains the higher-tier rising-rate interpretation; molecular collisions can form an enzyme–substrate complex; mineral-salt uptake by root hairs uses active transport.
- Higher-tier only: anaerobic respiration in muscle word equation: glucose → lactic acid; incomplete breakdown releases less ATP per glucose than aerobic respiration.
- Higher-tier only: calculate trophic-level energy-transfer efficiency = energy transferred to next level ÷ energy available at previous level × 100%; state transfer and loss pathways.
- Higher-tier only: nitrogen cycle—decomposers convert proteins/urea to ammonia; ammonia is converted to nitrates taken up by roots for protein; nitrogen fixation converts atmospheric nitrogen to nitrates; state factors that can lead to denitrification.
What to do in an assessment
- Work an energy-efficiency calculation with units and show ×100; use supplied values rather than assume transfer efficiency.
- Annotate a nitrogen-cycle diagram with chemical forms, named organisms/processes and arrow direction; distinguish fixation from denitrification.
- For the Higher-tier anaerobic equation, write glucose → lactic acid and compare its ATP yield with complete aerobic breakdown.
- For the Higher-tier enzyme-rate explanation, connect increasing temperature to increased molecular collision frequency; distinguish this mechanism from the common empirical rate-versus-temperature curve and optimum.
In plain language
Work an energy-efficiency calculation with units and show ×100; use supplied values rather than assume transfer efficiency.; Annotate a nitrogen-cycle diagram with chemical forms, named organisms/processes and arrow direction; distinguish fixation from denitrification.; For the Higher-tier anaerobic equation, write glucose → lactic acid and compare its ATP yield with complete aerobic breakdown.; For the Higher-tier enzyme-rate explanation, connect increasing temperature to increased molecular collision frequency; distinguish this mechanism from the common empirical rate-versus-temperature curve and optimum.
Self-check
What does a decomposer produce from proteins/urea in the stated nitrogen-cycle pathway?
Show the answer
Ammonia, which can be converted to nitrates and taken up by plant roots.
Topic group
Unit 2 Higher-tier extensions
- Core
Scope: Core · Unit 2 examination tier: Higher Tier · §2.2 Unit 2, Higher-tier statements in 2.1, 2.5 and 2.6
Open revision guidance
What to know
- Higher-tier only: estimate a population by capture–recapture and understand its assumptions.
- Higher-tier only: reflex arc sequence and labels—stimulus → receptor → sensory neurone → relay neurone/coordinator in the CNS → motor neurone → effector → response; at synapses, neurotransmitter is released, diffuses across the gap and triggers the next neurone. The impulse crosses synapses in one direction.
- Higher-tier only: nephron and blood-supply labels—glomerulus (capillary knot), Bowman’s capsule, tubule, collecting duct, capillary network and afferent/efferent arterioles. High pressure filters small molecules from blood into the capsule; cells and large proteins remain in blood. Selective reabsorption returns all glucose, some salts and much water from filtrate to blood. A dedicated nephron figure is attached as a candidate; its geometry and label arrows remain under parent review.
- Higher-tier only: negative feedback opposes a deviation and returns an internal condition toward its optimum. For blood glucose, high glucose stimulates insulin; low glucose stimulates glucagon and glycogen breakdown. Explain the specified body-temperature example as a response opposing the change.
- Higher-tier-only portions of mixed kidney outcomes (ADH and how a dialysis machine works) remain explicitly labelled in associated teaching; common material remains available to both tiers.
What to do in an assessment
- Capture–recapture estimate: first capture × second sample ÷ recaptured marked animals; list assumptions (mark retained, mixed, no effect on survival/capture, closed population).
- On a reflex or nephron diagram place required Higher-tier labels; in filtration explanations distinguish pressure filtration from selective reabsorption.
In plain language
Capture–recapture estimate: first capture × second sample ÷ recaptured marked animals; list assumptions (mark retained, mixed, no effect on survival/capture, closed population).; On a reflex or nephron diagram place required Higher-tier labels; in filtration explanations distinguish pressure filtration from selective reabsorption.
Self-check
A first sample marks 40 animals; a later sample of 50 contains 10 marked animals. Estimate population size.
Show the answer
40 × 50 ÷ 10 = 200 animals; the estimate assumes marks remain and mix evenly in a closed population.
View diagrams
A reflex arc through the spinal cordSchematic, not to scale. The nerve impulse crosses two synaptic gaps; axons do not form an uninterrupted path across either gap. Show labelled key: Answer key for reflex-arc
A reflex arc through the spinal cordSchematic, not to scale. The nerve impulse crosses two synaptic gaps; axons do not form an uninterrupted path across either gap. - AReceptor
- BSensory neurone
- CRelay neurone
- DSpinal cord
- EMotor neurone
- FEffector
- GSynapses (two gaps)
Nephron and its blood supplyQualitative schematic, not to scale. Water and small solutes are filtered into the capsule; blood cells and large proteins remain in blood. Glucose, needed solutes and much water are selectively reabsorbed into the peritubular capillaries. Show labelled key: Answer key for nephron-blood-supply
Nephron and its blood supplyQualitative schematic, not to scale. Water and small solutes are filtered into the capsule; blood cells and large proteins remain in blood. Glucose, needed solutes and much water are selectively reabsorbed into the peritubular capillaries. - AGlomerulus
- BBowman's capsule
- CTubule
- DCollecting duct
- EPeritubular capillary network
- FAfferent arteriole (into glomerulus)
- GEfferent arteriole (out of glomerulus)
Higher-tier Unit 2 practice/key diagrams only: reflex arc has seven labels (receptor, sensory neurone, relay neurone, spinal cord, motor neurone, effector and synapses); nephron/blood supply has seven (glomerulus, Bowman’s capsule, tubule, collecting duct, peritubular capillary network, afferent and efferent arterioles). Final geometry and label-arrow review passed for both.
Topic group
Mathematical handling
- Core
Scope: Core · Higher Tier in either Unit 1 examination tier or Unit 2 examination tier · Appendix C, Mathematical skill 4 (Handling data): appropriate significant figures
Open revision guidance
What to know
- For Higher tier, round a calculated or measured answer to the requested number of significant figures. Start counting at the first non-zero digit; zeros between significant digits count, leading zeros do not. Preserve a sensible precision and include the unit where the quantity has one.
What to do in an assessment
- Count significant figures from the first non-zero digit, round using the next digit, and check the result has the requested precision and correct unit.
In plain language
Count significant figures from the first non-zero digit, round using the next digit, and check the result has the requested precision and correct unit.
Self-check
Round 0.004786 to 2 significant figures.
Show the answer
The first two significant digits are 4 and 7; the next digit is 8, so the answer is 0.0048.
Earlier topic checklist
These earlier topic ticks are separate from the reviewed points above and do not count towards that progress.
Biology topic list
Tick each item off as you revise. Ticks are saved on this device only.
These ticks keep your earlier topic checklist. They do not count towards the new reviewed requirements above. Its numbering may be internal; use the linked references above for the exact reviewed source requirements.
Foundation tier topics
Higher tier topics
How OmniStudy helps you revise
- Answer exam-style questions on any topic below and get marked in seconds, with feedback on how to win more marks.
- Flashcards, quizzes and revision games generated for every topic.
- Practise real past papers with mark schemes.
- A study planner with an exam countdown, built around your weakest topics.
- Everything works in English and Welsh.
This guide is also available in Welsh (Cymraeg): Welsh (Cymraeg) guide
Ready to start?
Free to start. Pick your subject, answer a question, and see your first mark in minutes.
Start revising free